Liquidation Map Update
View predicted 'hidden' liquidity zones via MMT's new 'Liquidation Map' layer, which attempts to estimate where liquidation and stop loss orders may be triggered in future. New Footprint filtering and styling options were also added, along with customizable TPO colormaps - all bundled together with huge gains in terminal performance.
🚀 Liquidation Map
A cornerstone of MMT has been our full-depth, order book Heatmap. The heatmap overlays historical changes in the public order at each price level within the Order Book. The key word in that sentence there is 'public'. Limit orders used to enter an exit a position will be displayed within the public order book.
On the other hand, orders requiring a particular trigger such as stops, take-profits or liquidations are inherently invisible within the public book. These prices in which these triggered orders are known only to trader and the exchange. However, by analyzing patterns within historical flows we can attempt to estimate where such hidden liquidity, not shown within the public order book, may lay.
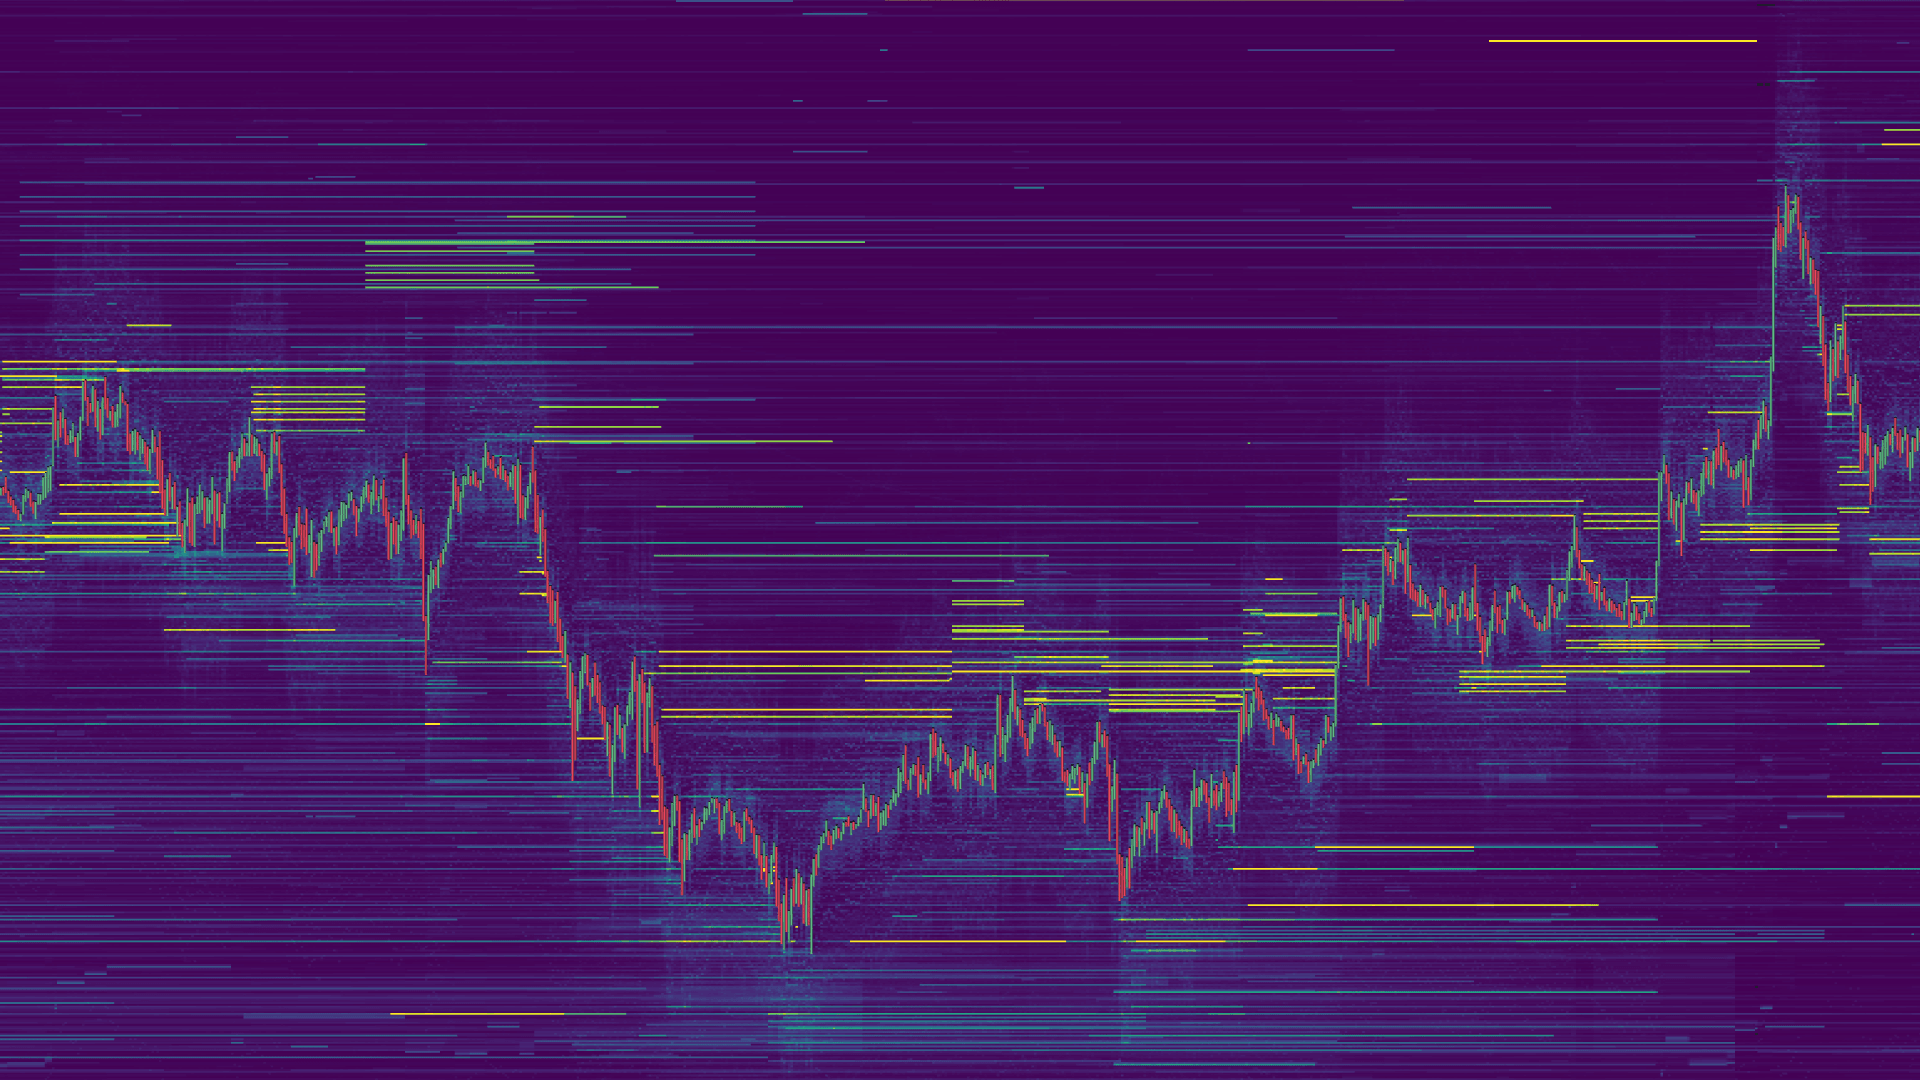
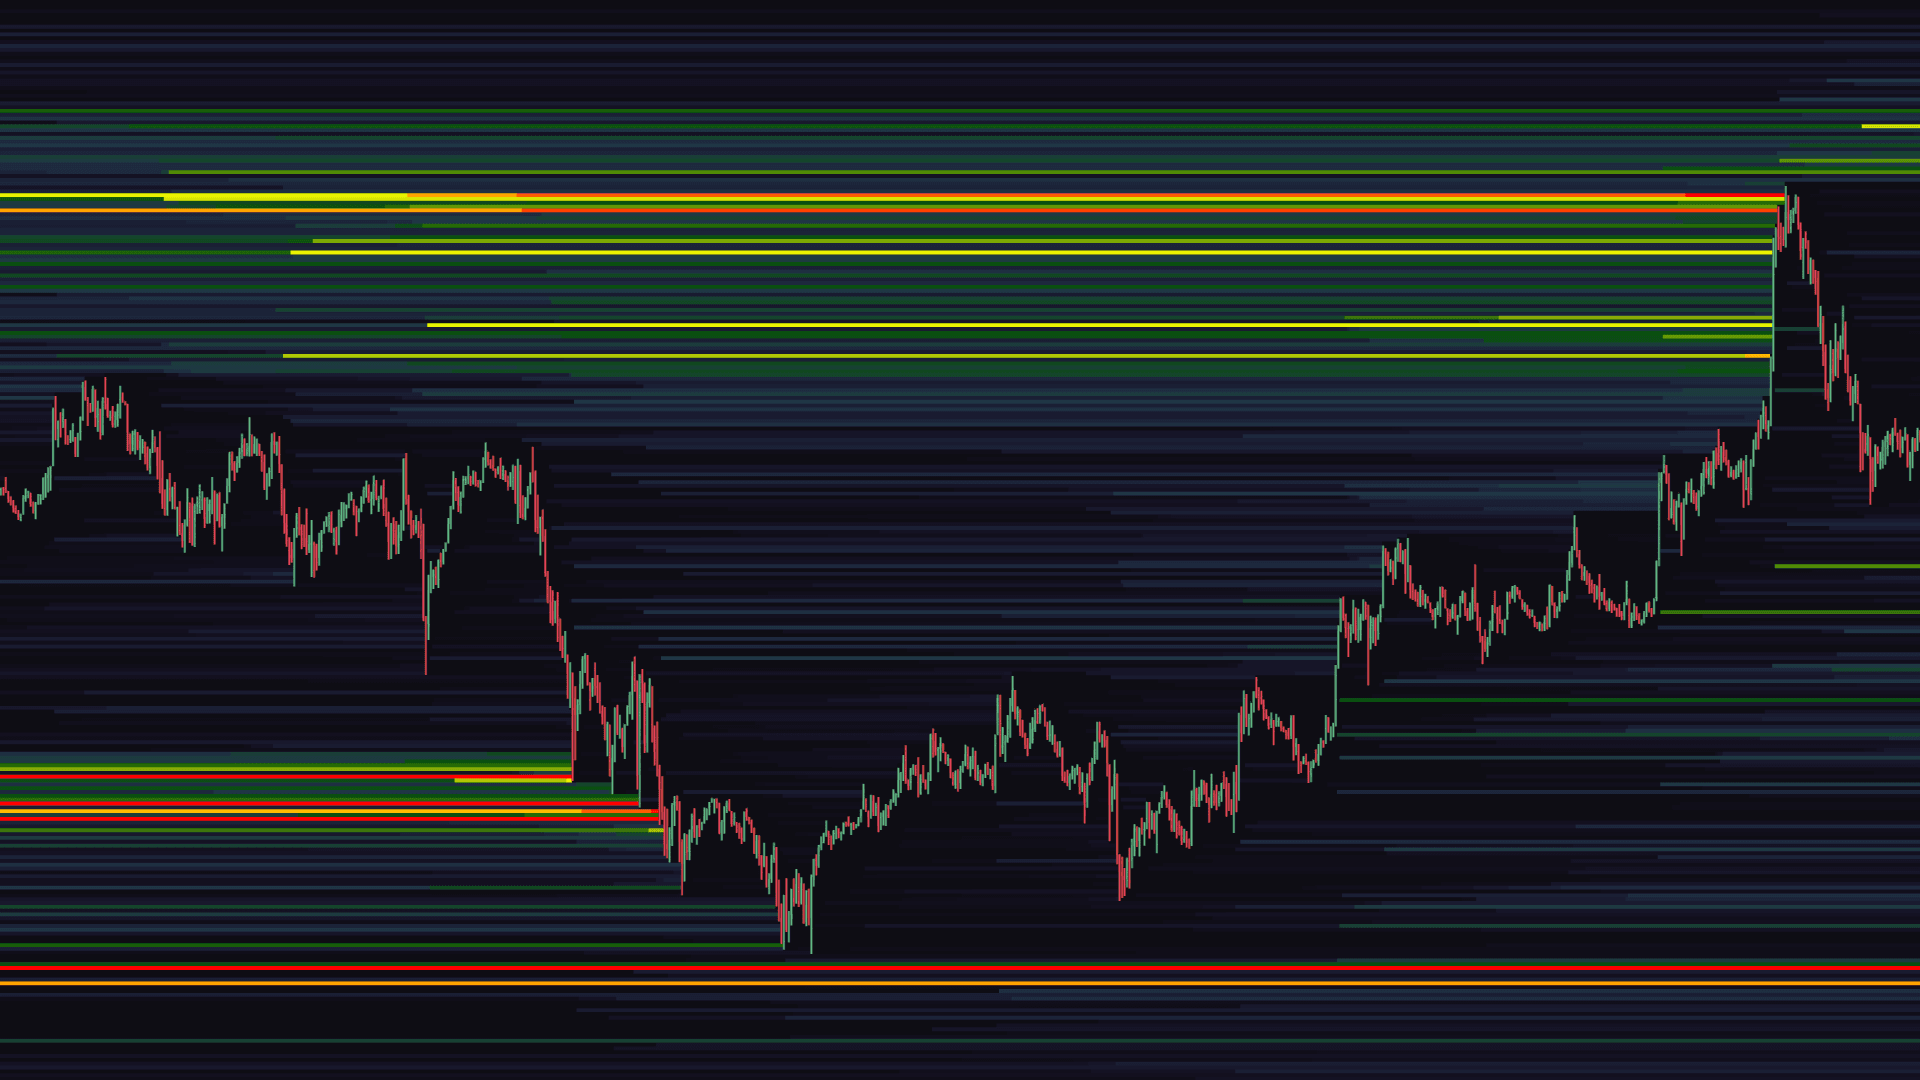
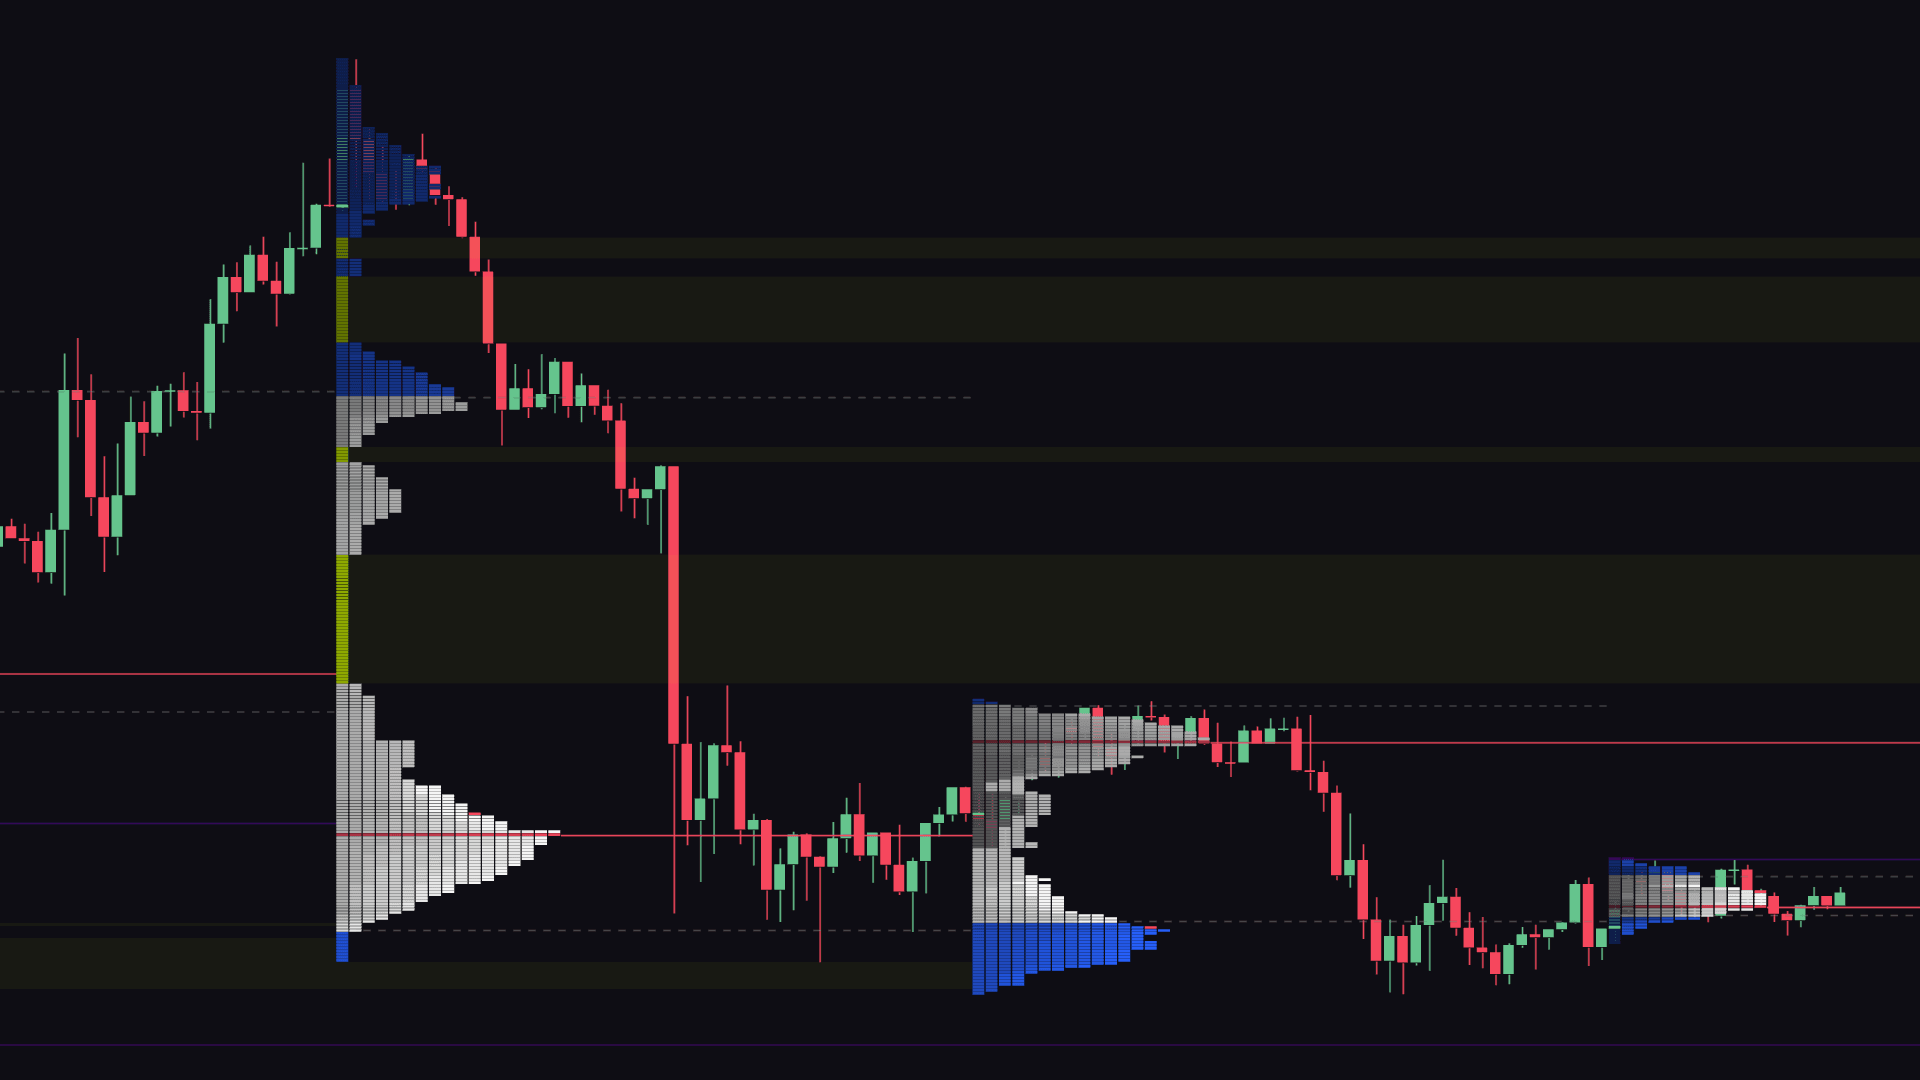
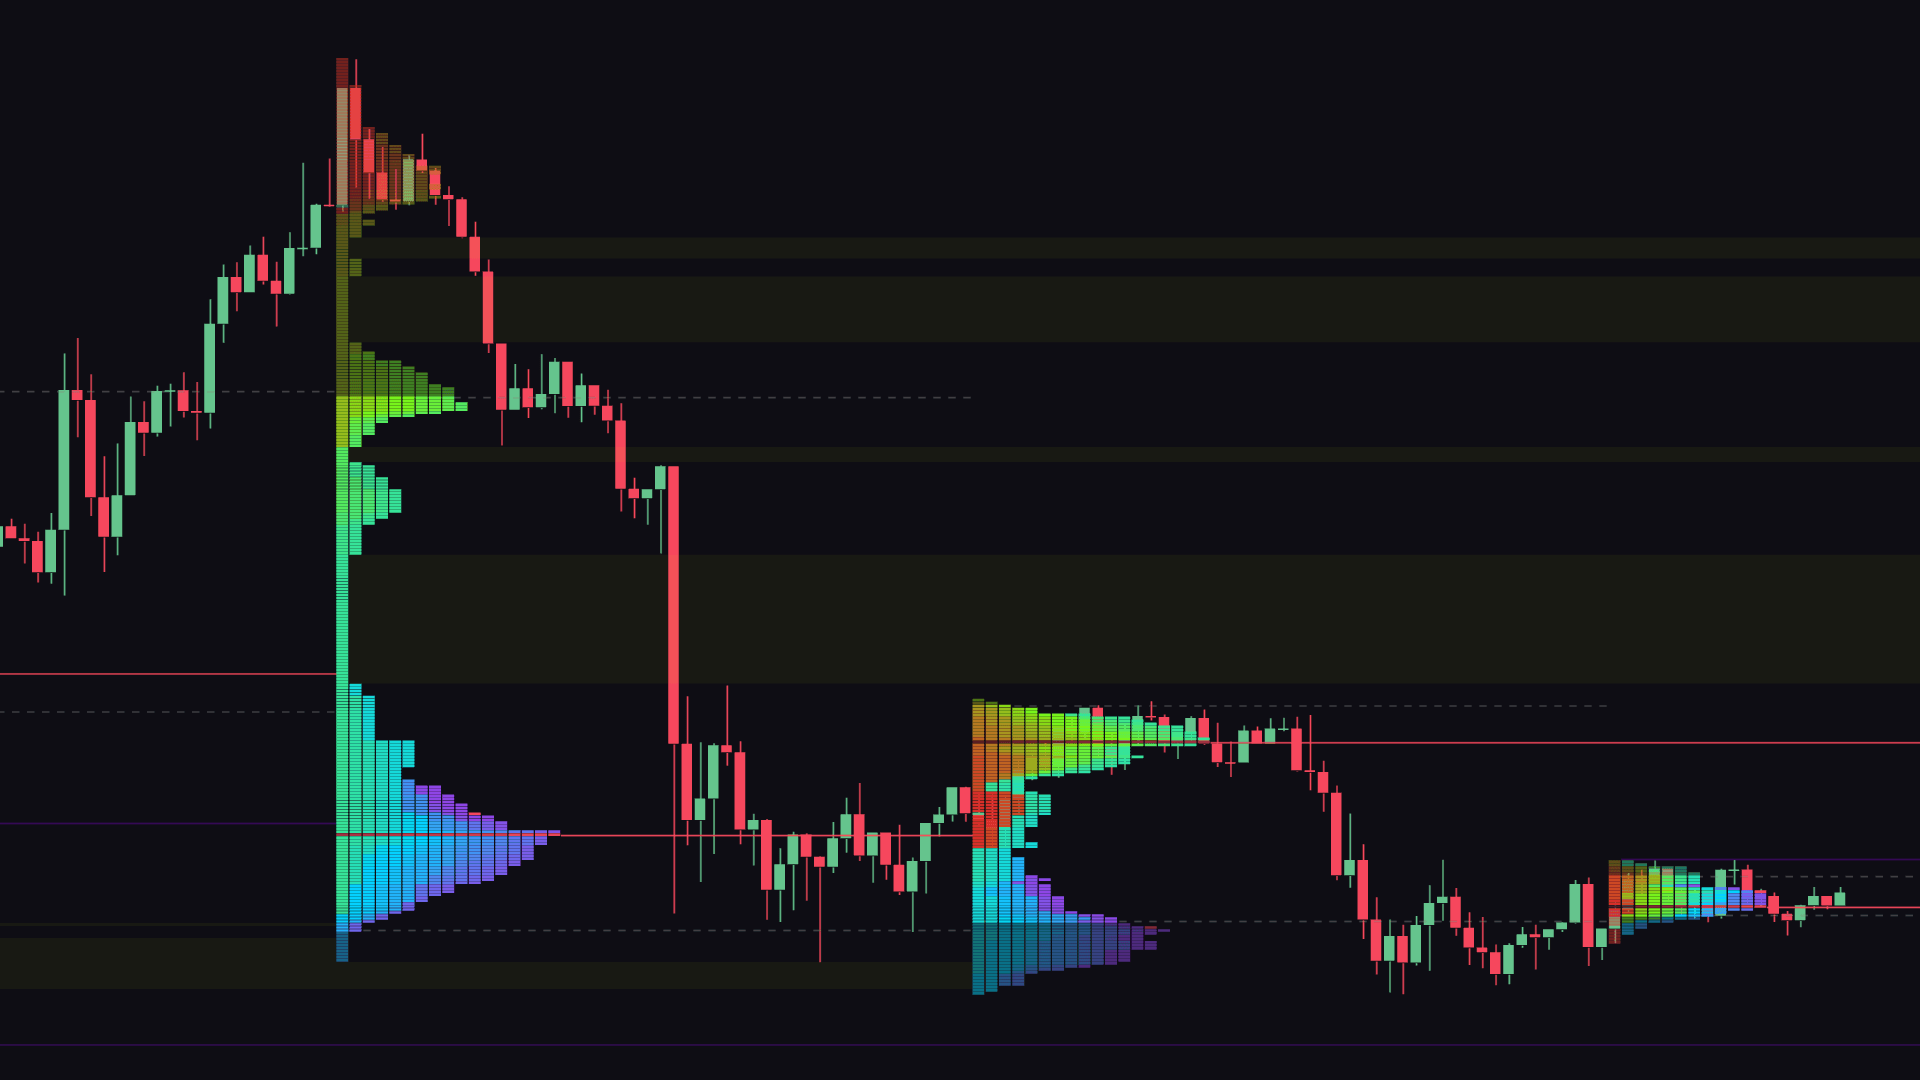
Predicted Liquidation Map vs Public Order Book Heatmap
Real-Time Graded Liquidation
Unlike others, the MMT Liquidation map does not ascribe the same value of predictive liquidity with each new plot. Whilst this can give the impression of pools or zones of liquidity, they are simply an accumulation of plots - each with the same initial weighting applied.
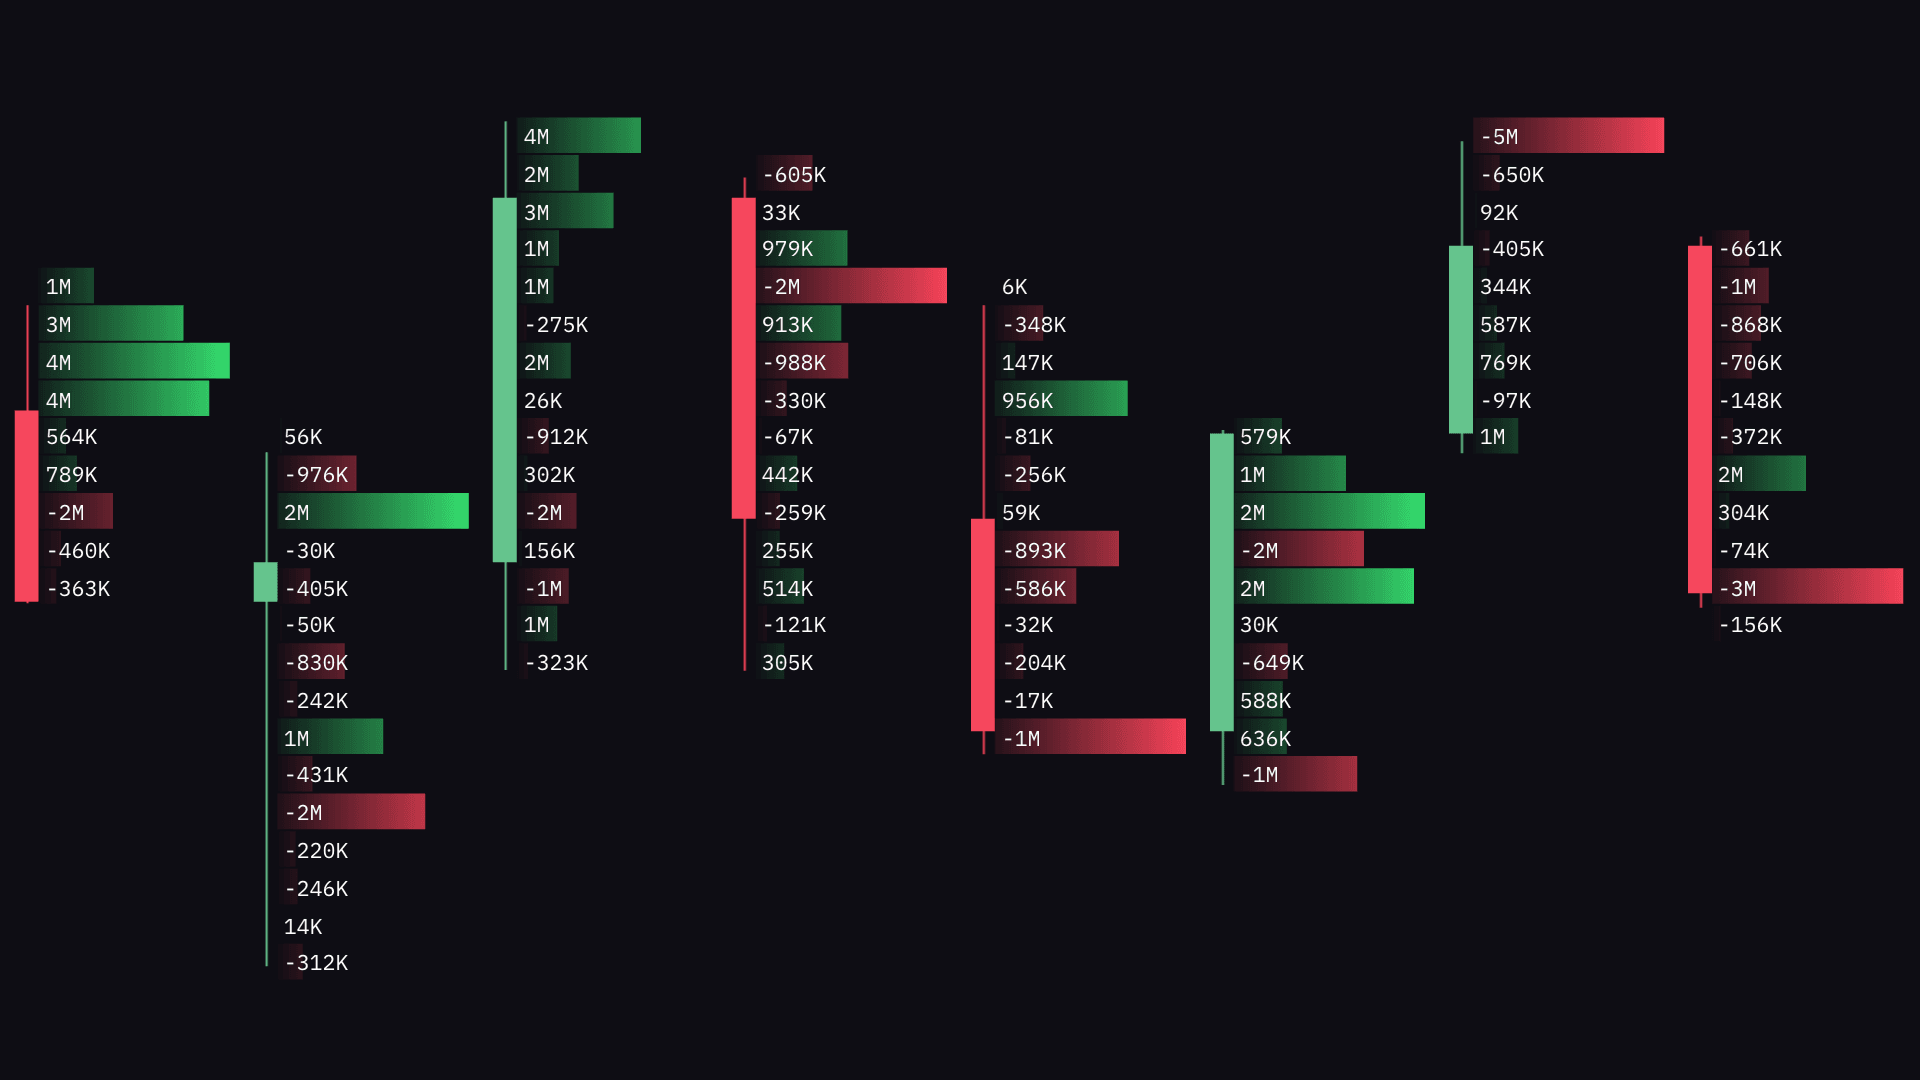
At MMT instead, live market data streams are parsed in real-time to measure the scale of deviations within flows of the current price action. This measure of deviation is then used to assign a weight to each plot. The weighting assigned is shown by the color grading used for the initial plot.
The greater the brightness or intensity of the initial plot, the greater the proportion of predicted liquidity is skewed more towards potential liquidations. Conversely, initial plots with reduced brightness or intensity indicate that the predicted liquidity is likely skewed more towards potential stop orders.
Whilst the MMT liquidation map will still accumulate new subsequent plots, the important distinction, is the initial intensity of each new plot. Our approach is designed to predict areas of hidden liquidity of potentially greater significance, far earlier in the short term, than waiting for a linear accumulation of plots. The intensity of this grading is fully configurable.
Liquidation Map Inputs
Within the layer, you have a range of settings to help filter and adjust the overall render of the Liquidation Map. Given the nature of the layer, the majority of the inputs you are familiar with in the Heatmap are also found within the Liquidation Map's layer settings. There are however dedicated inputs native to the Liquidation Map which we will cover below.
Leverage Toggles
Incremental levels of leverage can be toggled within the Liquidation Map settings. As you toggle, the render will adjust to either incorporate or exclude the predicted liquidity associated with each level of leverage.
Tick Per Row
Similar to the range of order flow tools available on MMT, the Liquidation Map also has a dedicated Tick Per Row input. This will determine the price grouping used for each plot of the Liquidation Map. This input should be adjusted to suit the market and timeframe are viewing.
Zero Compromise, Full Chart Approach
Unfortunately, due to the complexities of rendering full-bleed heatmaps, many platforms awkwardly try to embed or overlay over a TradingView chart. Others segregate it entirely from any other dashboard or chart. Not on MMT.
The Liquidation Map is just like any other layer on MMT. Feel free to combine with any other layer without having to compromise latency or the inherent smooth performance of the terminal. Even combine and overlay with the order book heatmap for a full view on both publicly know and predicted liquidity analysis.
Predictive in Nature
The Liquidation Map released today is predictive in nature. Only the trader and the respective exchange will know true price in which a position will be stopped or liquidated. Today's new layer attempts to assess market flows, to try to predict where such areas of liquidity may reside.
🚀 Performance Gains
Buttery smooth performance is the MMT standard. As the range of features expands so too does the flexibility of the terminal. Whilst this is by design, we need to ensure that your browser can keep pace. A core principle within our development flow, is to take opportunities to optimize the terminal wherever possible. Today's update brings a number of these to your Terminal.
Multi Threaded
We are excited to announce that MMT now leverages a multi-threaded architecture, a significant upgrade from the previous single-threaded design. This transformation unlocks faster, more efficient client processing by distributing workloads across multiple CPU threads. By design, this new approach to architecture will allow greater scope for further optimizations in future.
Memory Efficiency
To accompany the new multi-threaded architecture, multiple improvements have been made to how the terminal utilizes available memory. This is of particular importance given differences between user's devices and respective usable memory. In addition general improvements to memory usage, a couple of intermittent leaks were also patched.
Performance Outcomes
By optimizing resource utilization, the terminal can now handle increasingly complex calculations and tasks concurrently. Here are a number of these benefits:
Lighter Client Footprint - Improvements to client processing efficiency have resulted in an overall reduction in resource usage.
Load Large Layouts at Speed - Layouts render almost twice as fast, allowing the ability to switch between complex layouts with minimal latency.
Idle for Days - Improvements to memory usage now ensures advanced multi-widget layouts can remain idle over long, multi-hour/day sessions without causing a fuss.
These performance upgrades reflect our commitment to delivering market-leading performance for professional trading workflows.
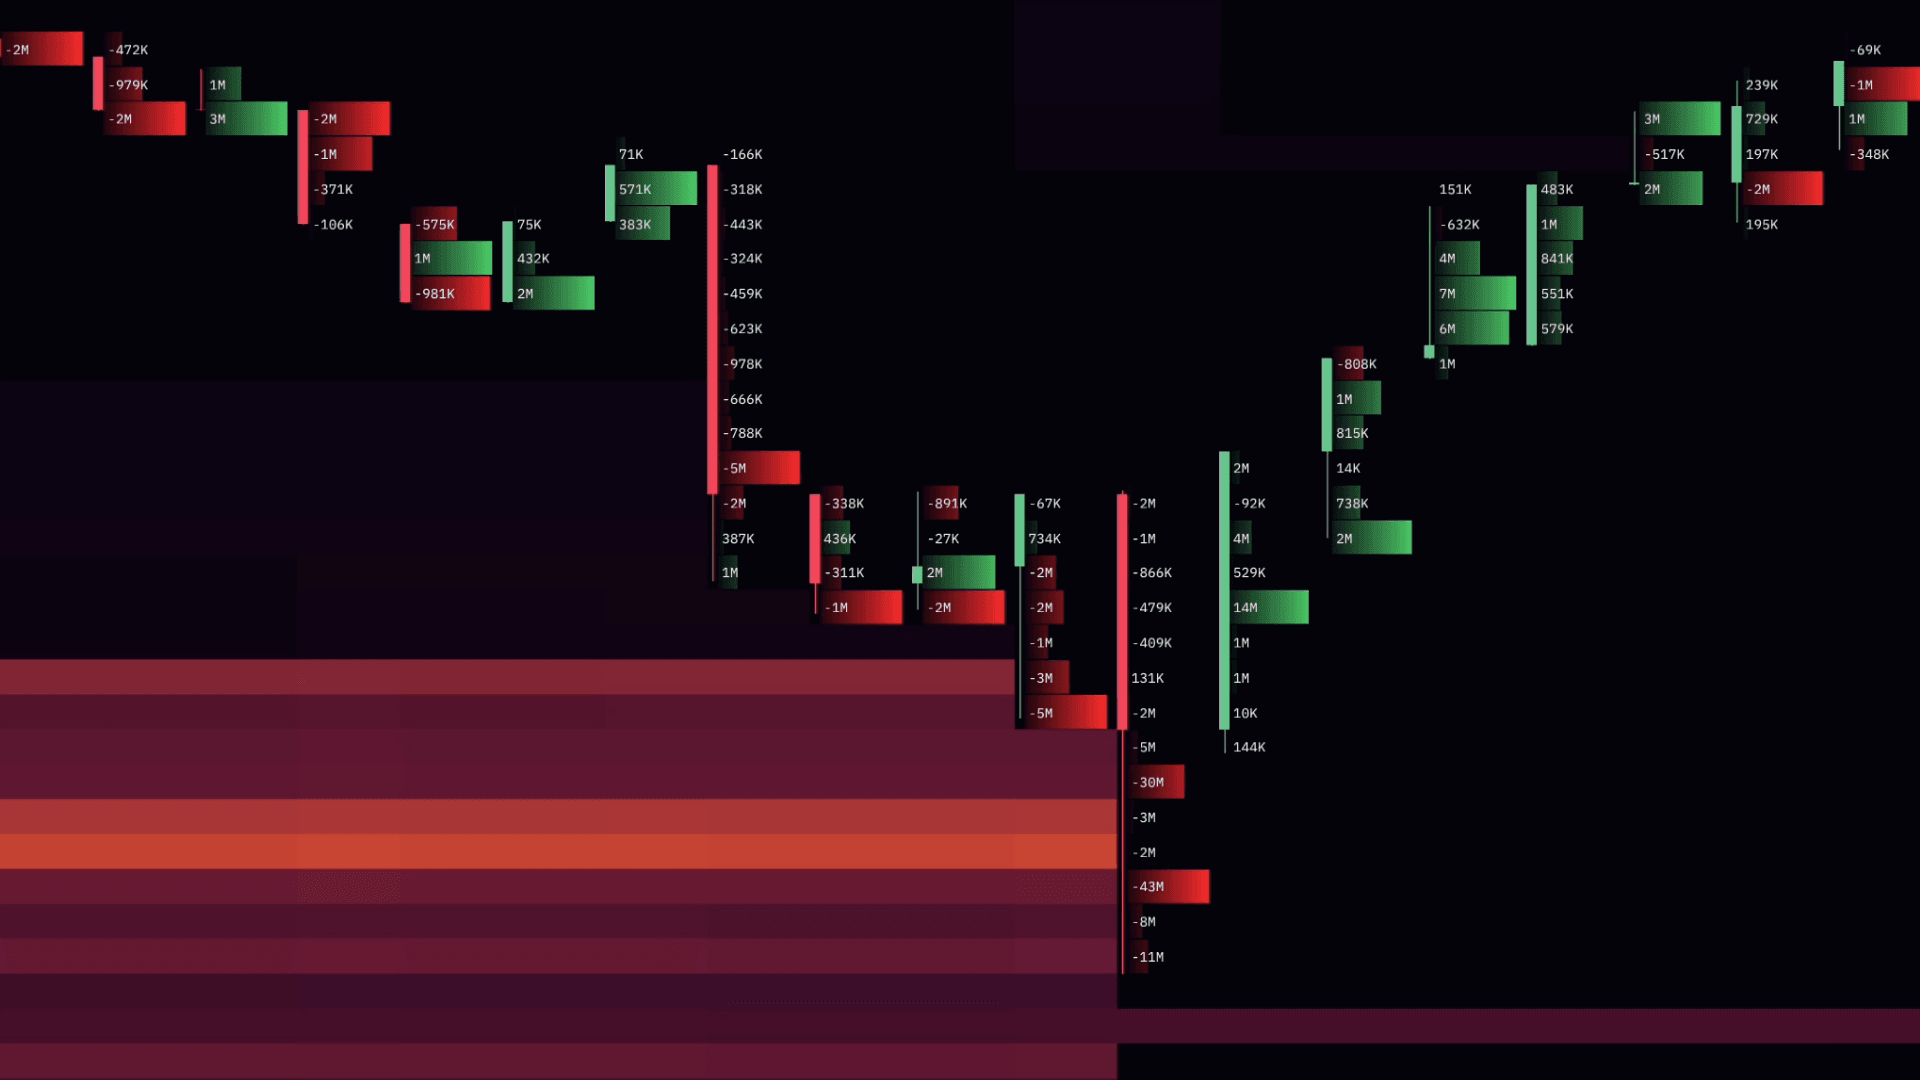
⭐️ Footprint Thresholds
Footprints have received some love this update. Within the Footprint layer you know have a new filtering option called 'Threshold Filter'. Within this input, you can determine the value in which nodes within the footprint are rendered. This will prevent the rendering of all nodes that fail to reach you configured input.
The mode that your Footprints are set to, will determine the threshold type that will be required to be exceed to render. For example, if in 'Total Volume' mode, the value entered within the Threshold will determine the total volume required in order to render each row within the footprint. This is a great quality of life improvement and acts as a middle ground between the various grading options such as 'Individual Candle' & 'Visible Range'.
⭐️ Footprint Gradients
Another minor quality of life improvement this update, is the new 'Gradient' styling option. Using this option allows you to better visualize higher total volume, or disproportionately high/low delta nodes within the footprint itself.
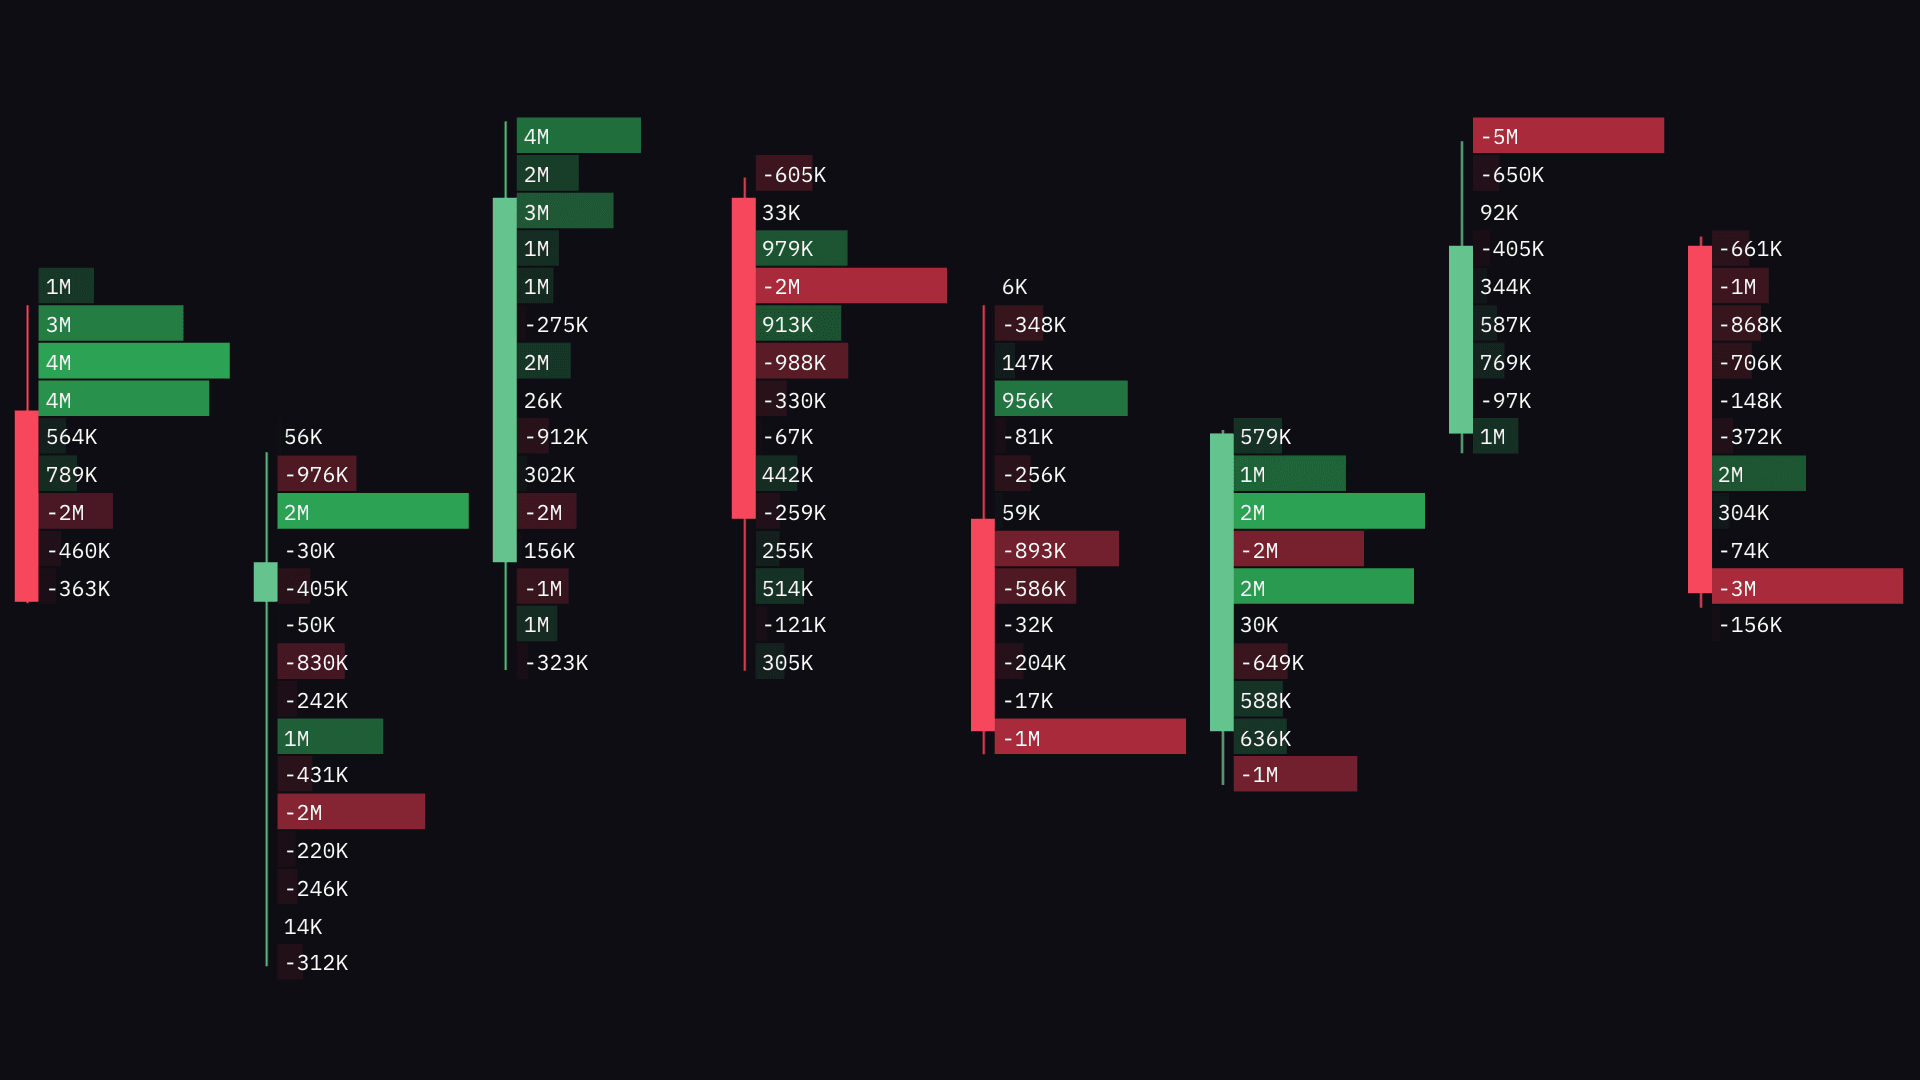
Gradient vs Non-Gradient
This can be a handy addition when combined with the new Footprint thresholds. When used together, the render of each node within the footprint offers a great way to visually filter live order flow. Not a fan of the gradient? No worries. This option isn't enabled as default.
⭐️ TPO: Customizable Colormaps
Custom colormaps are now available to TPO within today's update. There are a total of four color pickers when this mode is enabled, allowing you to blend and grade different hues.
Colormap vs Default
As you'd expect all merge and split is fully functional when using your custom color map. In the future we plan to retain merges and splits between terminal sessions.
⭐️ Expand Chart Shortcut
Last week we added the ability quickly focus on a particular chart widget within MMT, allowing you to quickly expand to fill the terminal window. This week we are making it easier than ever, via basic keyboard shortcut - ctrl/cmd + enter.
🐛 Bug Fixes
As the Terminal grows in features, so does the complexity involved to keep your experience as fluid as possible. There were a few little bugs and conflicts had crept in. Happy to announce the following issues have been solved.
Heatmap - Aggregation no longer forced / appended when changing pairs in quick succession.
Aggregation - Prevented intermittent sum issue when navigating between inverse perpetual markets.
TPO - Fixed Volume Profile 'Overlay' not rendering in the correct position.
Trade Feed - Will now use local time if enabled globally.
Trade Feed - Curbed overly-aggressive rounding of lower-priced markets.
Chart Expand - Prevented widget conflict if added whilst chart expanded.
Chart Expand - Expanded chart returns to tabbed group in original order and positioning.
Brush Tool - Prevented dragging of previous stokes, if 2nd stroke origin was in proximity.
Layouts - Provisionally fixed issue with larger layouts leading to crashed upon import.
Chart - Increased pane border thickness to allow easier distinction when multiple underlays active.
🧑🍳 Currently Cooking…
Drawing Tool Expansion - The initial drawing tools introduced in our previous update will be expanded in addition to object management and organization.
Order Book Liquidity Indicators - New indicators used to measure changes in the order book will be introduced over the next few updates.
Aggregation Expansion - Following on from our first round of aggregation, additional layers and widgets within your terminal will have the ability aggregate your preferred data sources.