Trade with flow.
Not against it.
Monitor flows like a professional. Ultra-low latency, tick-level market data streams. Examine order flow from every perspective via the Market Monkey Terminal. Advanced footprint charting, accompanies an arsenal of tools to measure market order size, volume, deltas and count.
Advanced Footprint Charts
Raw, real-time order flow into structured visual intelligence. Examine execution flow with clarity - visualize volume, delta with highly configurable grading, imbalance markers, and naked POCs derived from from raw tick market order data.
Advanced Footprint Charts
Raw, real-time order flow into structured visual intelligence. Examine execution flow with clarity - visualize volume, delta with highly configurable grading, imbalance markers, and naked POCs derived from from raw tick market order data.
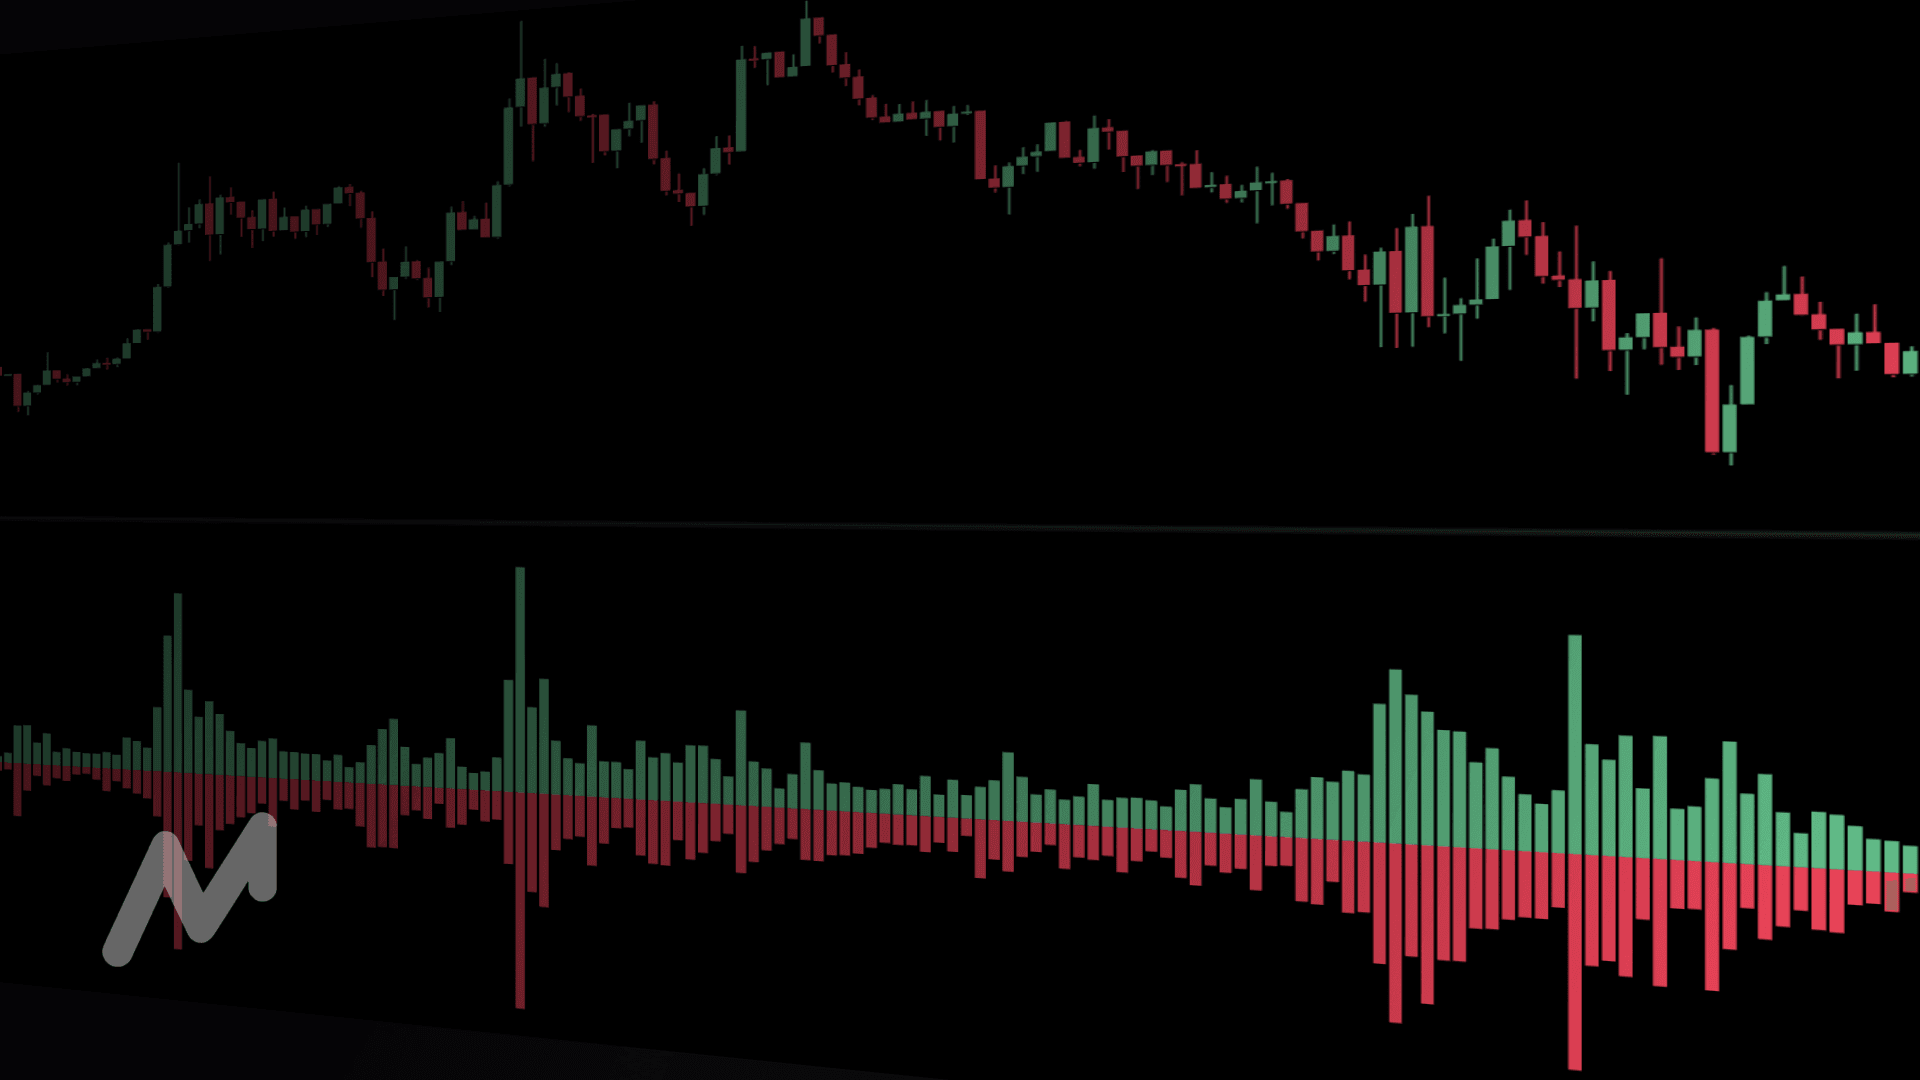
CVD - Cumulative Volume Delta
Capitalize upon sub-second sampled volume deltas to capture the full power of CVD. View full Min/Max delta rotation context, when assessing the market for absorption or exhaustion.
CVD - Cumulative Volume Delta
Capitalize upon sub-second sampled volume deltas to capture the full power of CVD. View full Min/Max delta rotation context, when assessing the market for absorption or exhaustion.
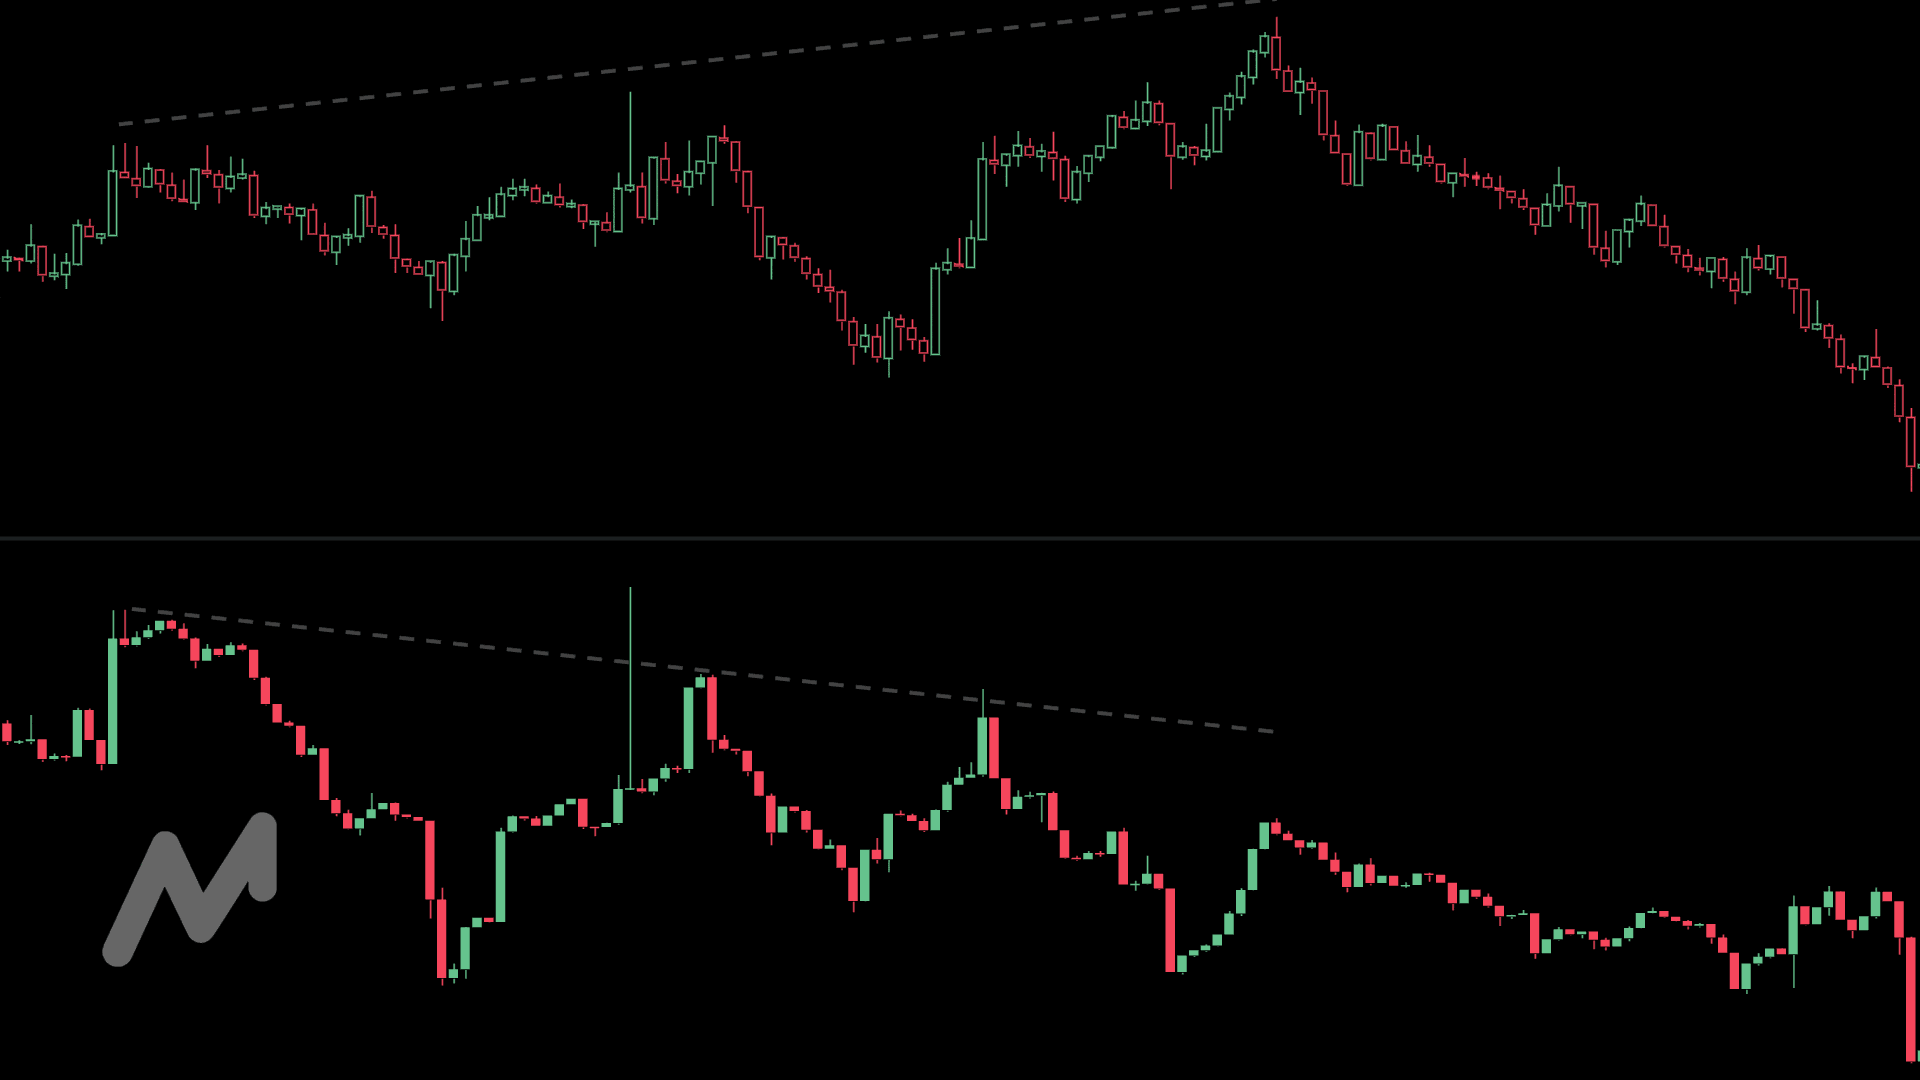
VWAP - Volume Weighted Average Price
Leverage tick-level precision and flexible anchoring of MMT's VWAP. Add multiple simultaneous plots to identify key inflection zones and evolving market bias in real time.
VWAP - Volume Weighted Average Price
Leverage tick-level precision and flexible anchoring of MMT's VWAP. Add multiple simultaneous plots to identify key inflection zones and evolving market bias in real time.
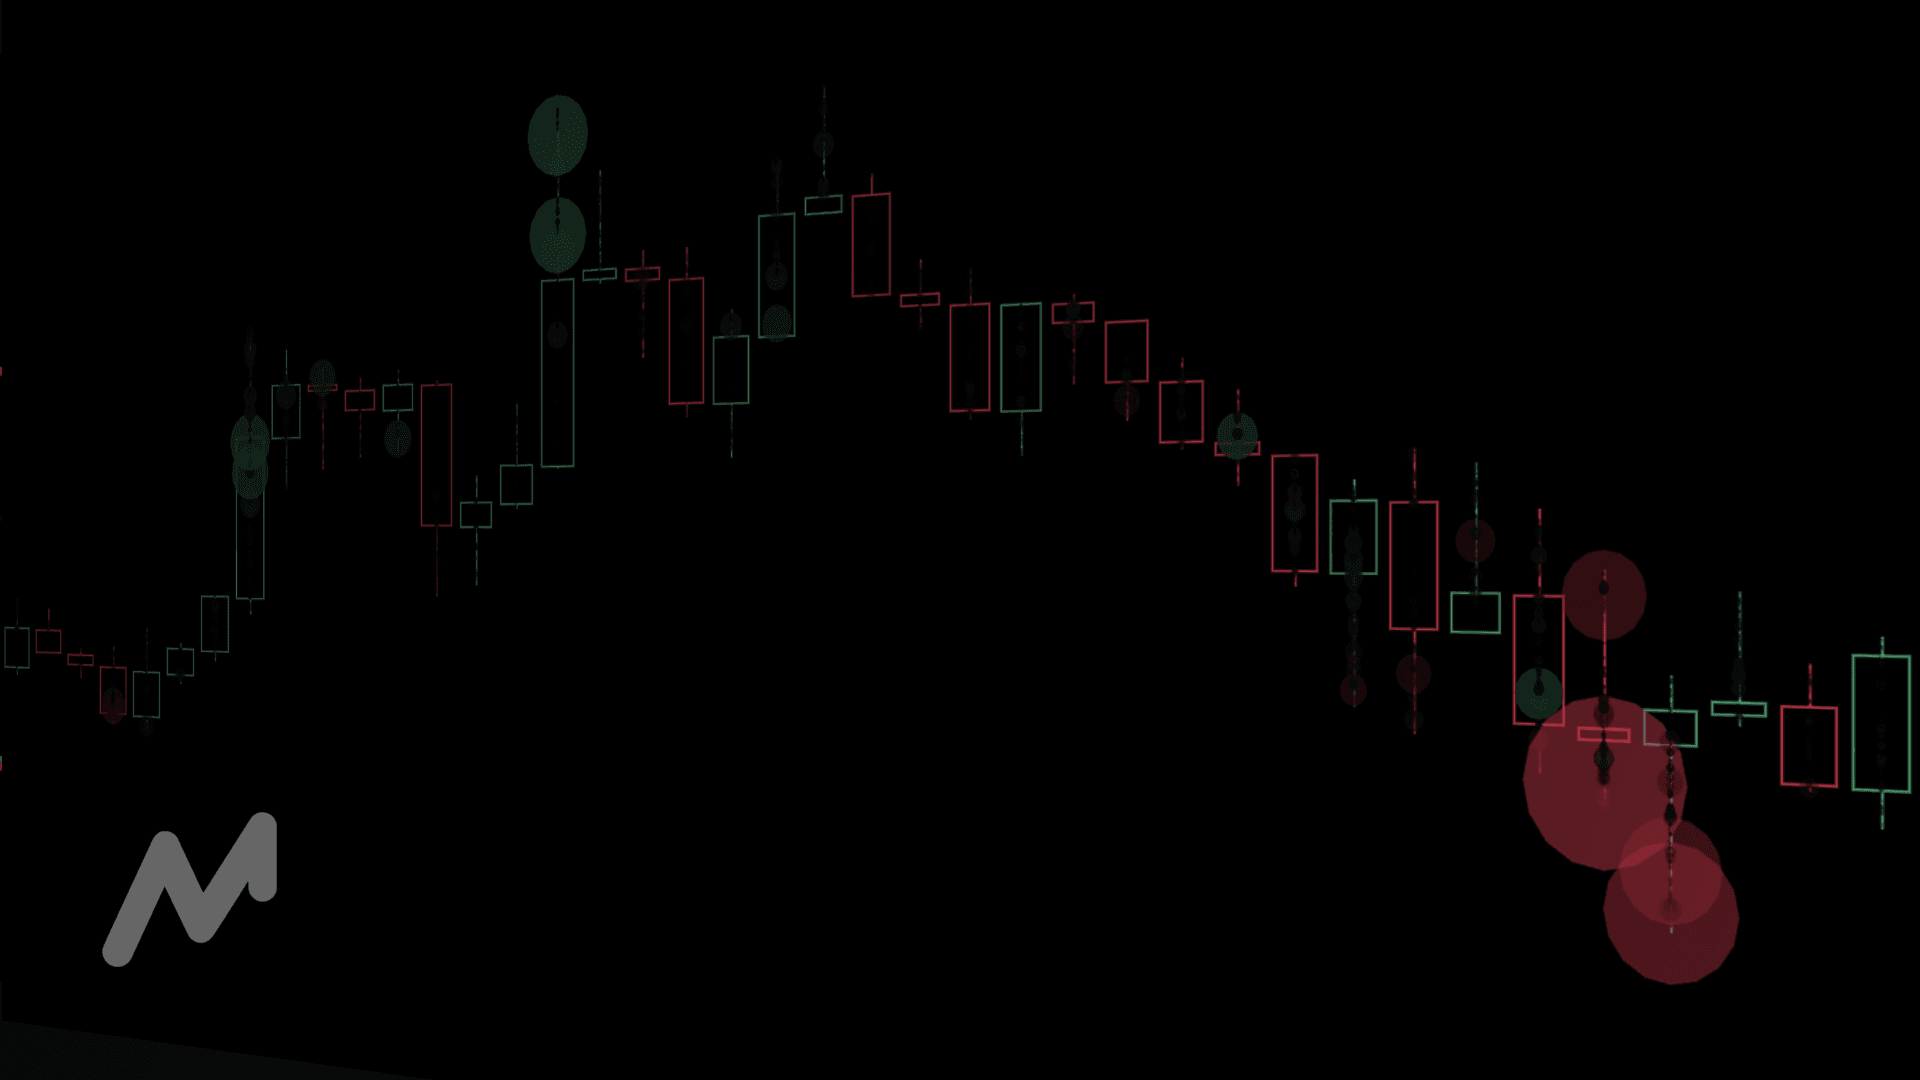
Volume Bubbles
Bring market order aggression to life with visually scaled volume bubbles. Spot dominant players instantly with proportional sizing & custom volume/delta filtering, to uncover where large volume is hitting the tape.
Volume Bubbles
Bring market order aggression to life with visually scaled volume bubbles. Spot dominant players instantly with proportional sizing & custom volume/delta filtering, to uncover where large volume is hitting the tape.
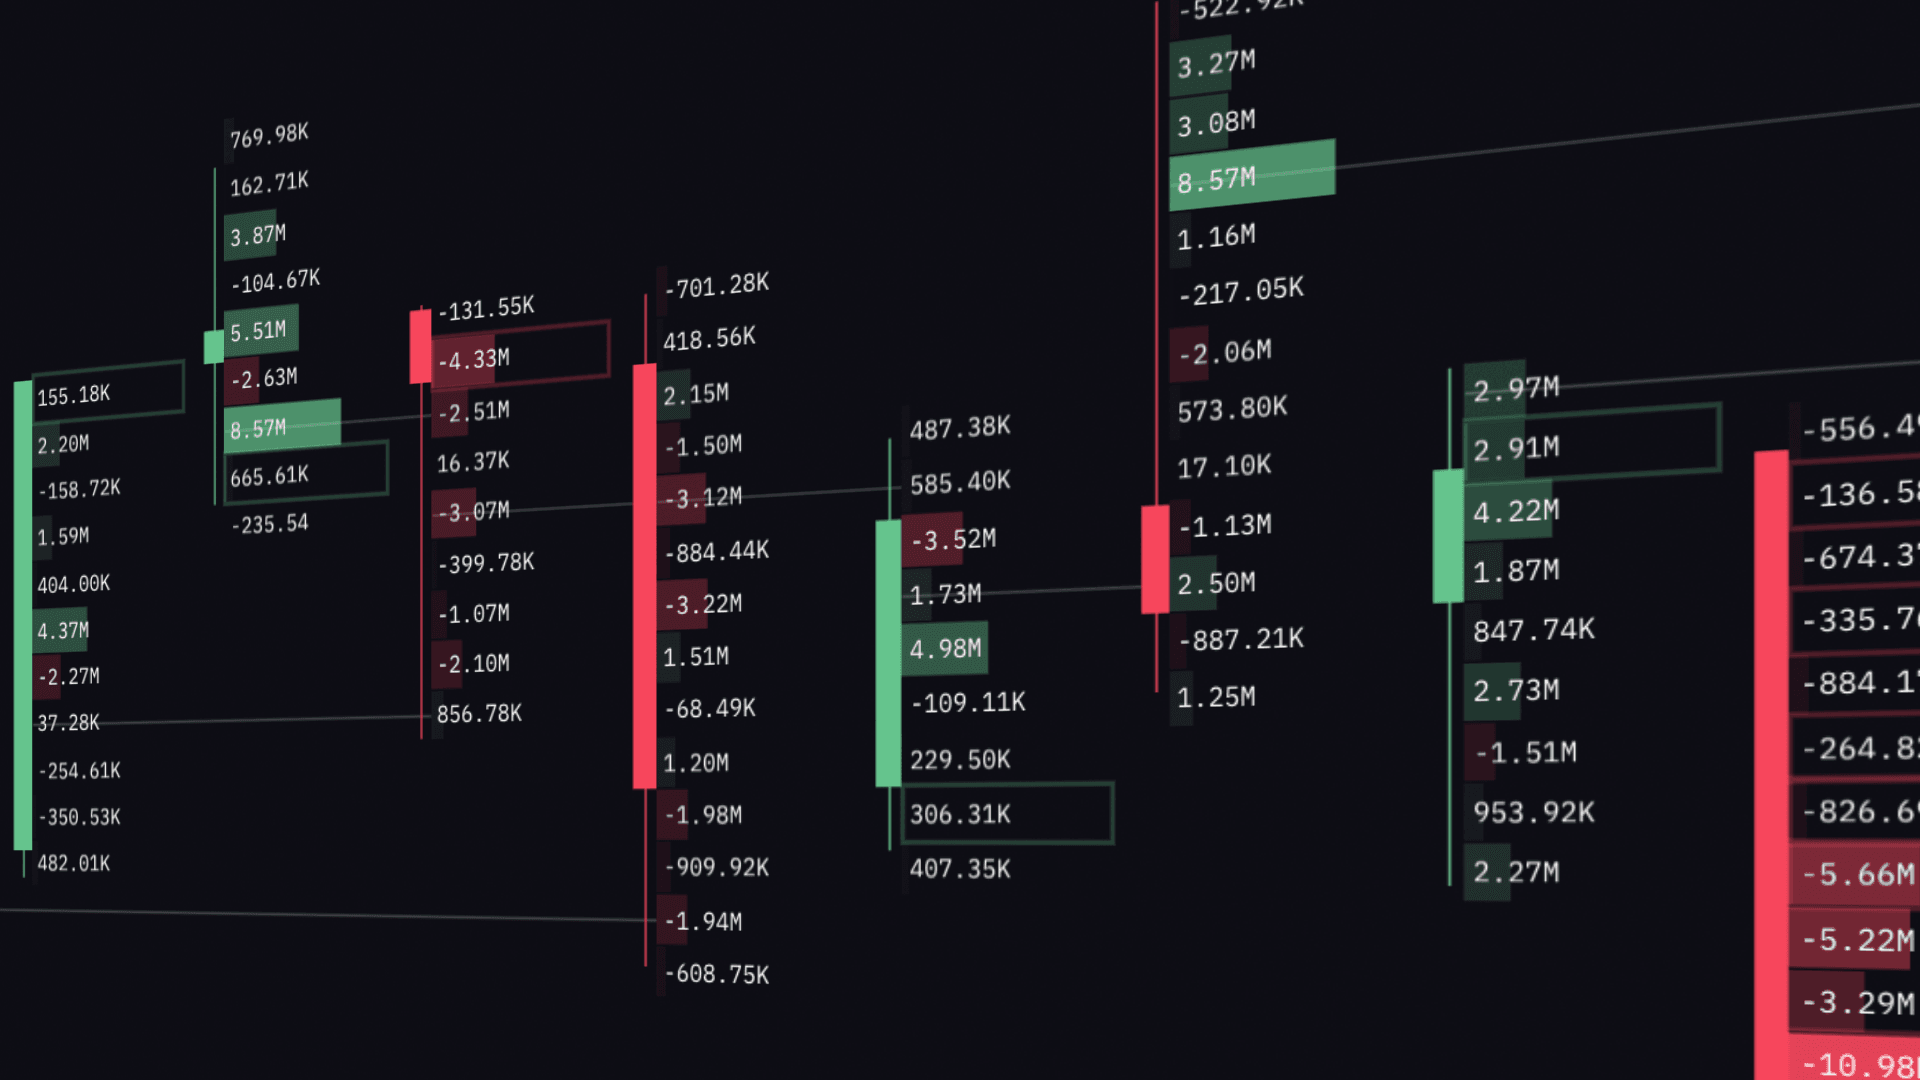
Bar Stats
Quantify and compare market data as intensity-graded overlays. From single bar to full-chart context, highlight relative trade and volume metrics anomalies, quickly and efficiently.
Bar Stats
Quantify and compare market data as intensity-graded overlays. From single bar to full-chart context, highlight relative trade and volume metrics anomalies, quickly and efficiently.
Trade Counter
Reveal the pace of market executions with separate buy/sell trade counts. Dual histogram layout isolates execution flow, offering refined visibility into participation bias and intensity shifts over time.
Trade Counter
Reveal the pace of market executions with separate buy/sell trade counts. Dual histogram layout isolates execution flow, offering refined visibility into participation bias and intensity shifts over time.
Leverage Liquidity. Don't be Liquidity.
Join 18,000+ traders aggregating order book data across the world's leading exchanges.