Net Longs & Net Short Update
MMT's first proprietary indicator is here! Estimated Net Longs & Net Short positioning data is live, along with a bunch of other improvements and bug fixes.
New Net Longs & Net Shorts Indicators
Whilst Open Interest may indicate the number of contracts held within open positions with futures markets, it does not tell us how these are necessarily positioned. Today's update brings two new indicators to MMT that attempt to determine this - Net Longs and Net Shorts.
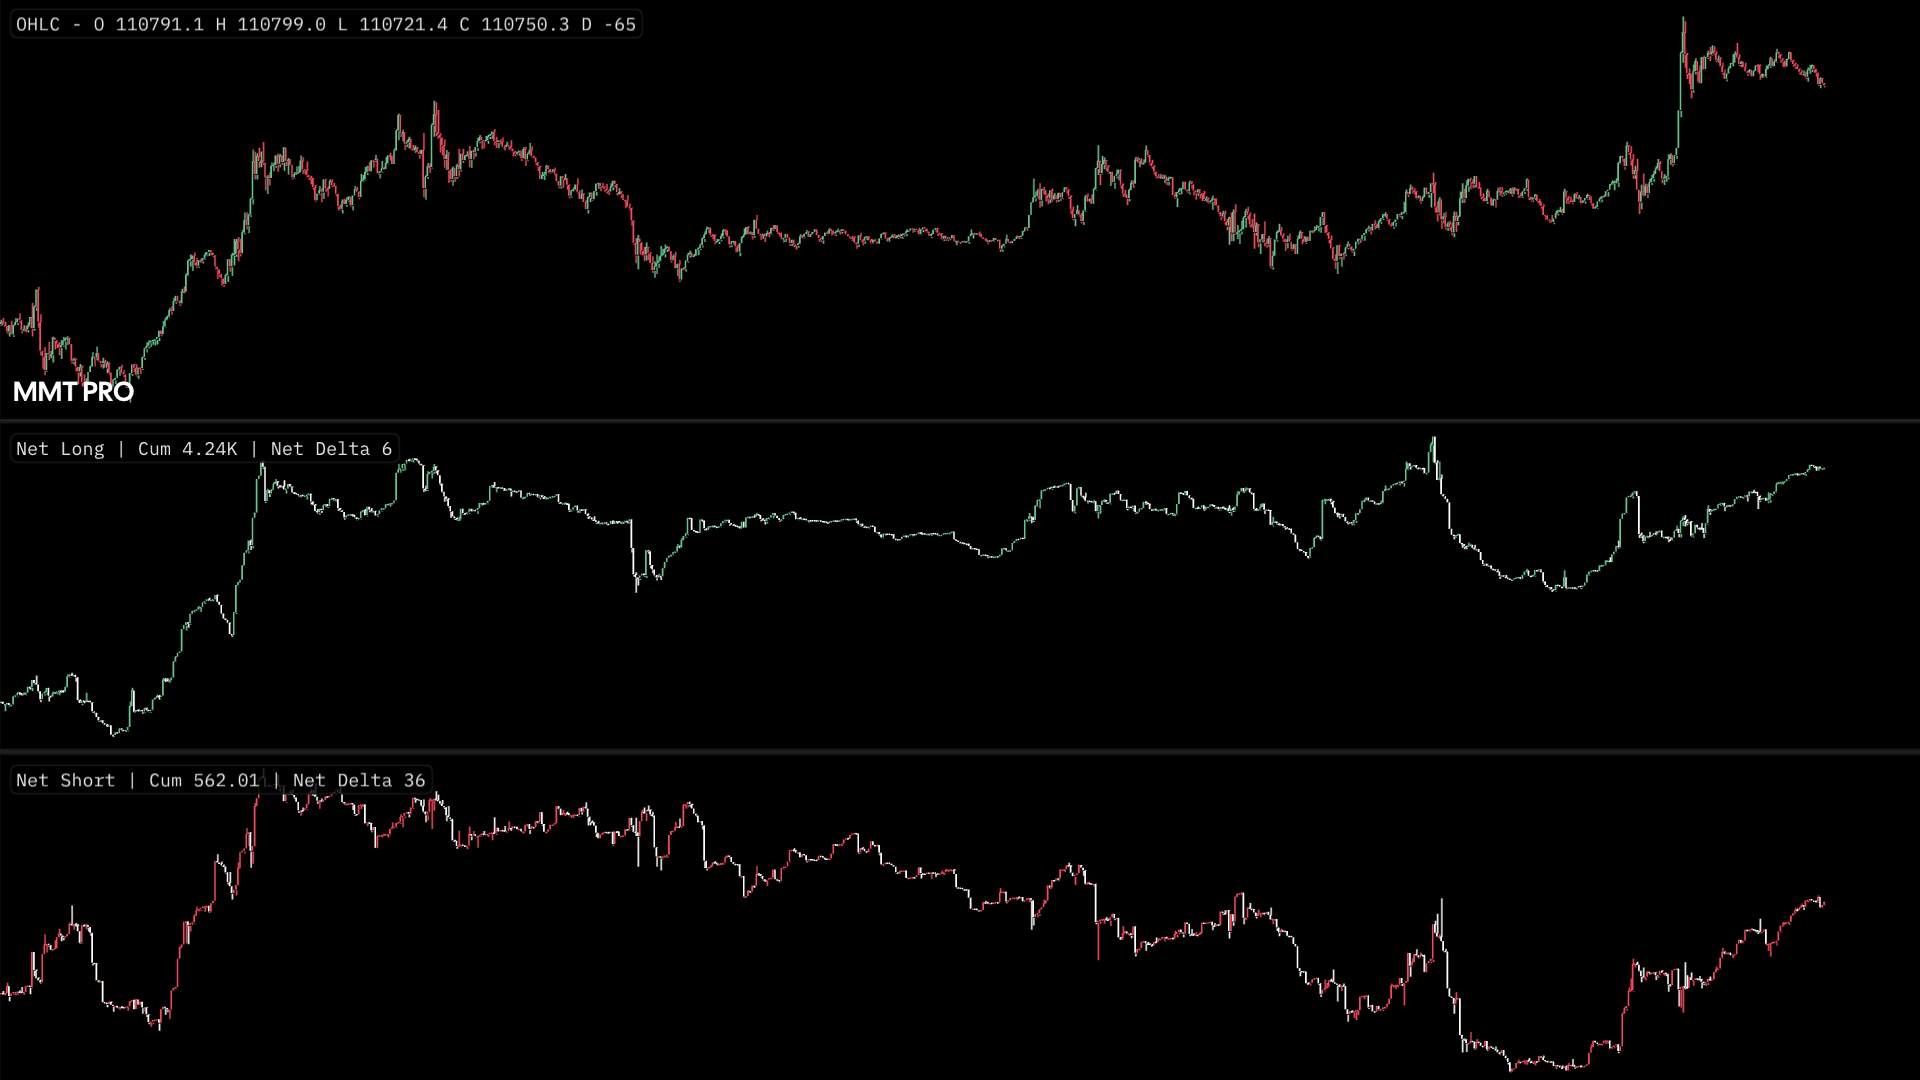
This indicator attempts to attribute changes in OI, to net changes in overal long and short positioning by market participants. Changes within Open interest are ultimately distributed in an attempt to determine whether longs or shorts, are opening/adding to positions, or closing/cutting positions.
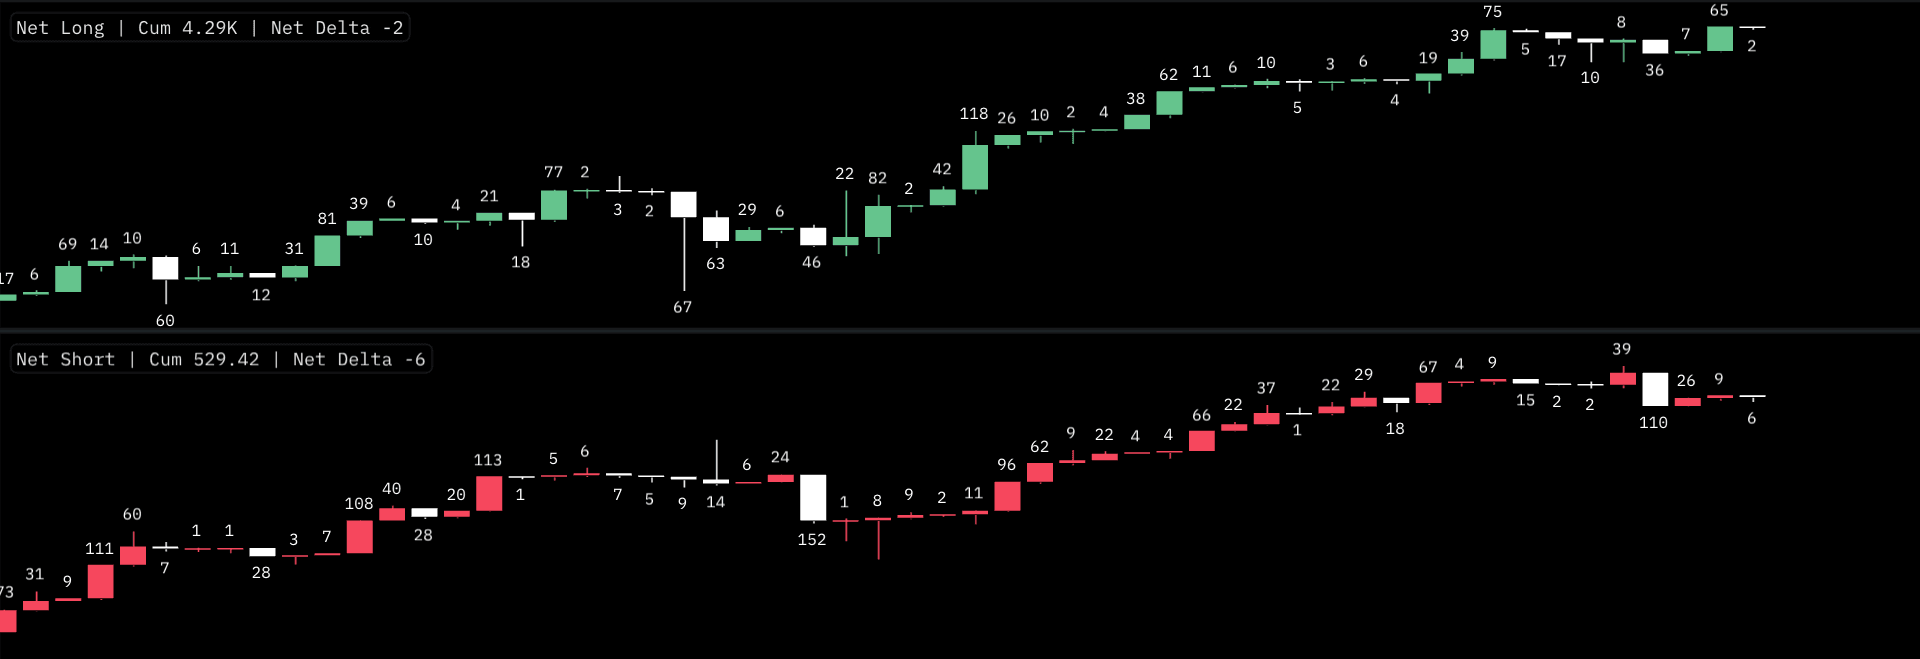
To visually distinguish between other candlestick layers such as CVD or Open Interest, each indicator has its own color scheme. By default;
- Net Longs - Uses a lime color for an increase in possible net long positioning.
- Net Shorts - Uses a red color for an increase in possible net short positioning.
Note that the outputs from this indicator are experimental. Please see the dedicated Net Longs & Net Shorts learn article for more information.
⭐️ Improvements
⭐️ Back-End Infrastructure Upgrades We are currently in the process of upgrading server capacity, which should effectively double our compute capability to handle more clients as MMT grows. This will also help us to scale our data ingestion and processing capabilities as we support new exchanges and pairs.
⭐️ Label Values Crosshair Sync All underlay layers' label values will now update in sync with the crosshair. This will be applied on a horizontal basis - particularly to profile layers in a future update.
🐛 Bug Fixes
Fixed absent footprint rendering on daily timeframes for some pairs. Fixed CVD line plot shift / opening print. Fixed intermittent bar limit issue for some volume underlay indicators Fixed keyboard support, inc modifier keys.