Candle CVD, Historical Data, New Heatmap Styles & UI Improvements
Summer is officially here and this update from the Market Monkey Team is just as scorching hot. Let's dive in to see what's new and improved within the terminal.
🚀 Candlestick CVD
The CVD - Cumulative Value Delta layer has been given some love this update with the new ability to display as a candlestick chart. Although to some the CVD line plot may perhaps be easier to use to spot divergences with price, there are inherent benefits to this new candlestick view.
The primary advantage to this candlestick view is the 2 additional data points that are provided. Unlike the line plot that will print the opening/closing value of CVD, the candlestick view will also display the highest and lowest intra-candle delta prints.
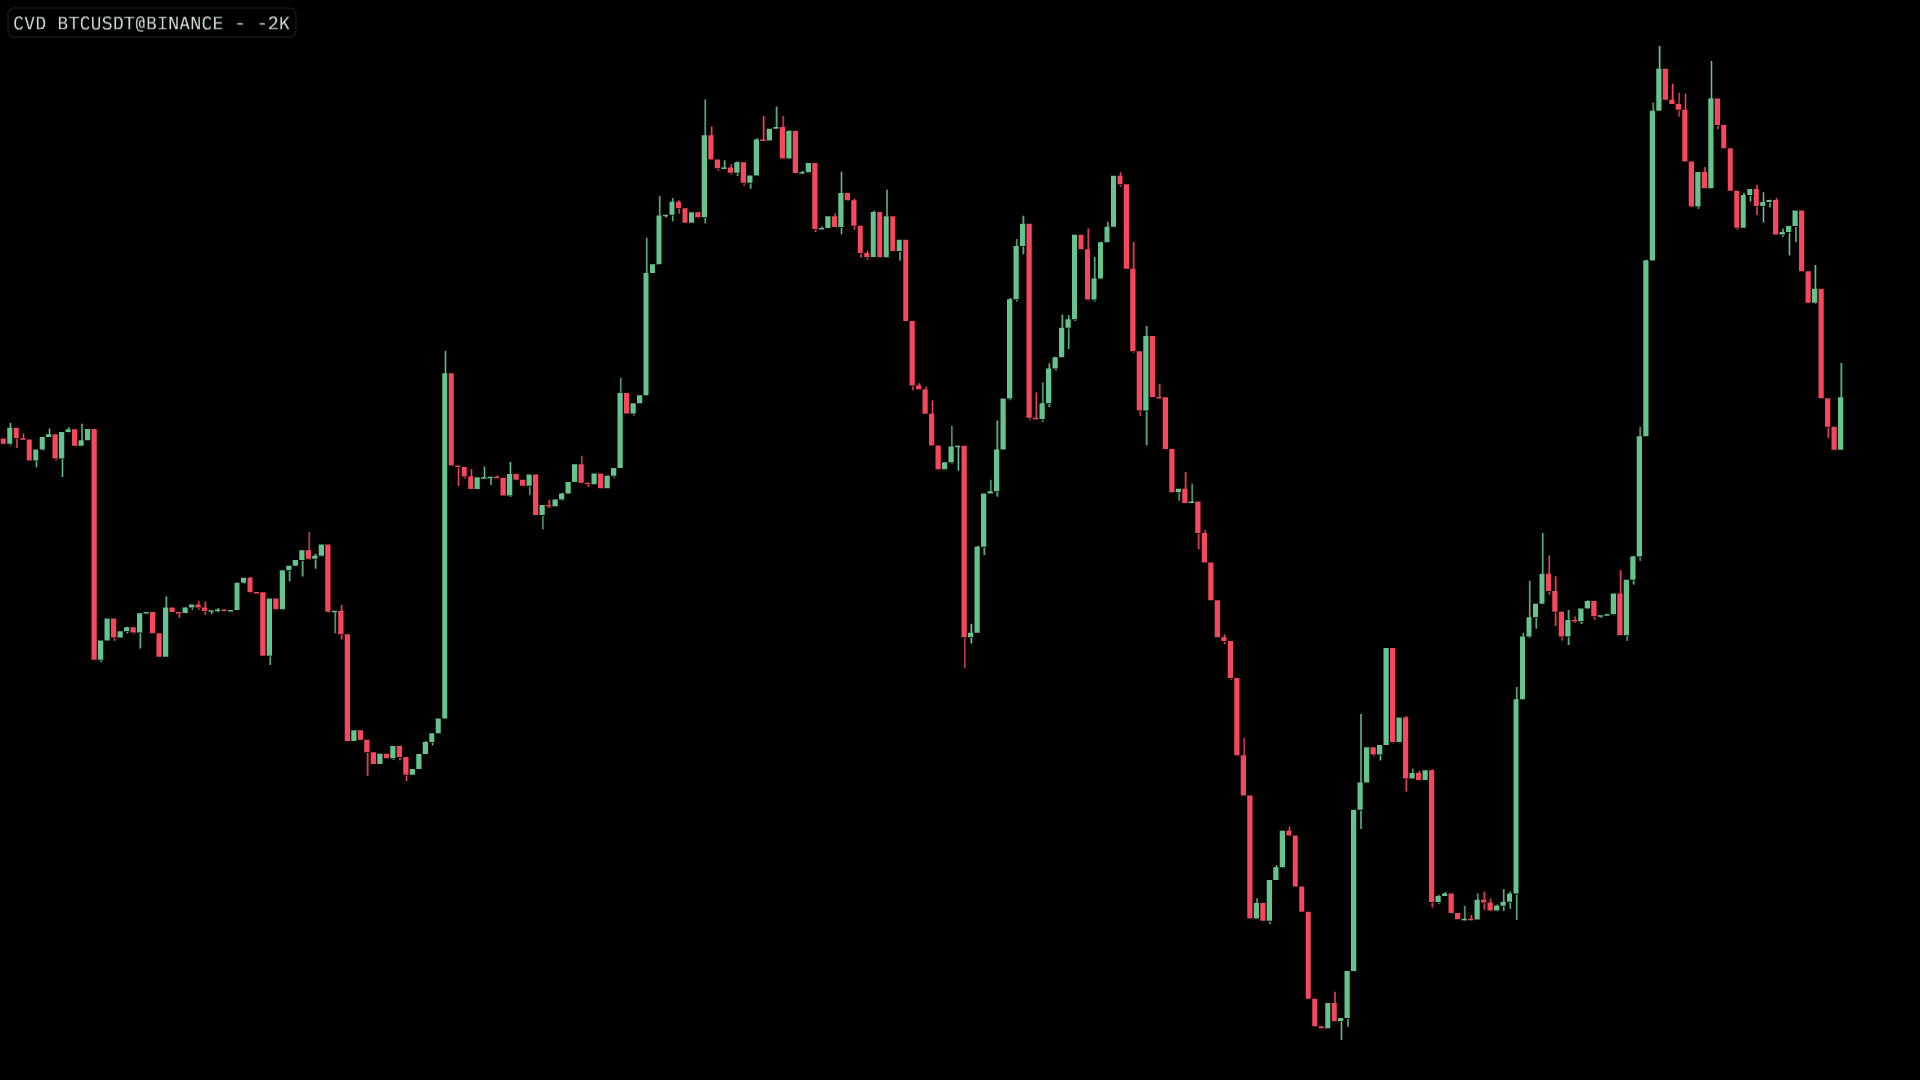
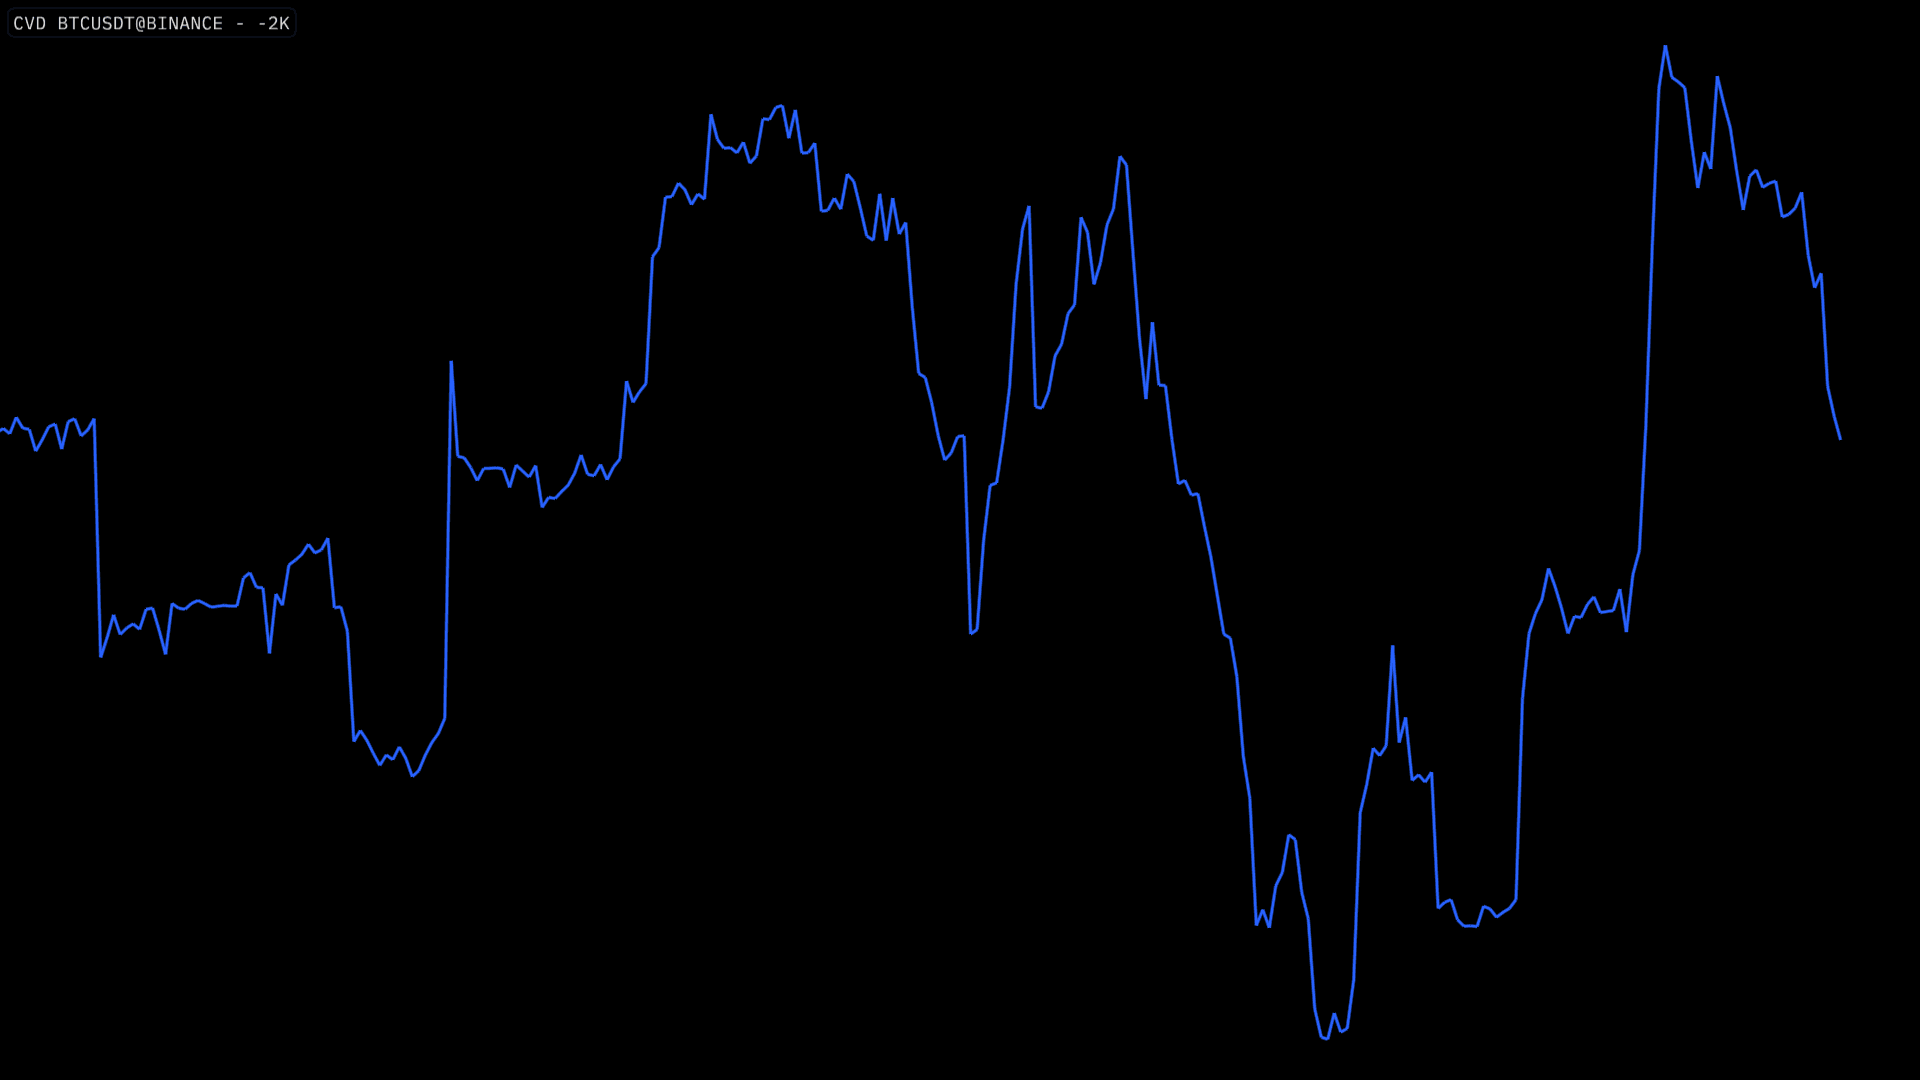
← Line Plot vs Candlestick →
The ability to see the full min and max delta allows you to view in detail of the full rotation in delta. Also this change to how we record market order volume at MMT, is the first initial small steps towards non-time based rotations.
🚀 New Candlestick Styling
You'll notice within the CVD layer, there are new candlestick options within the configuration menu. We've rebuilt the candlestick layer to allow a greater degree of styling options.
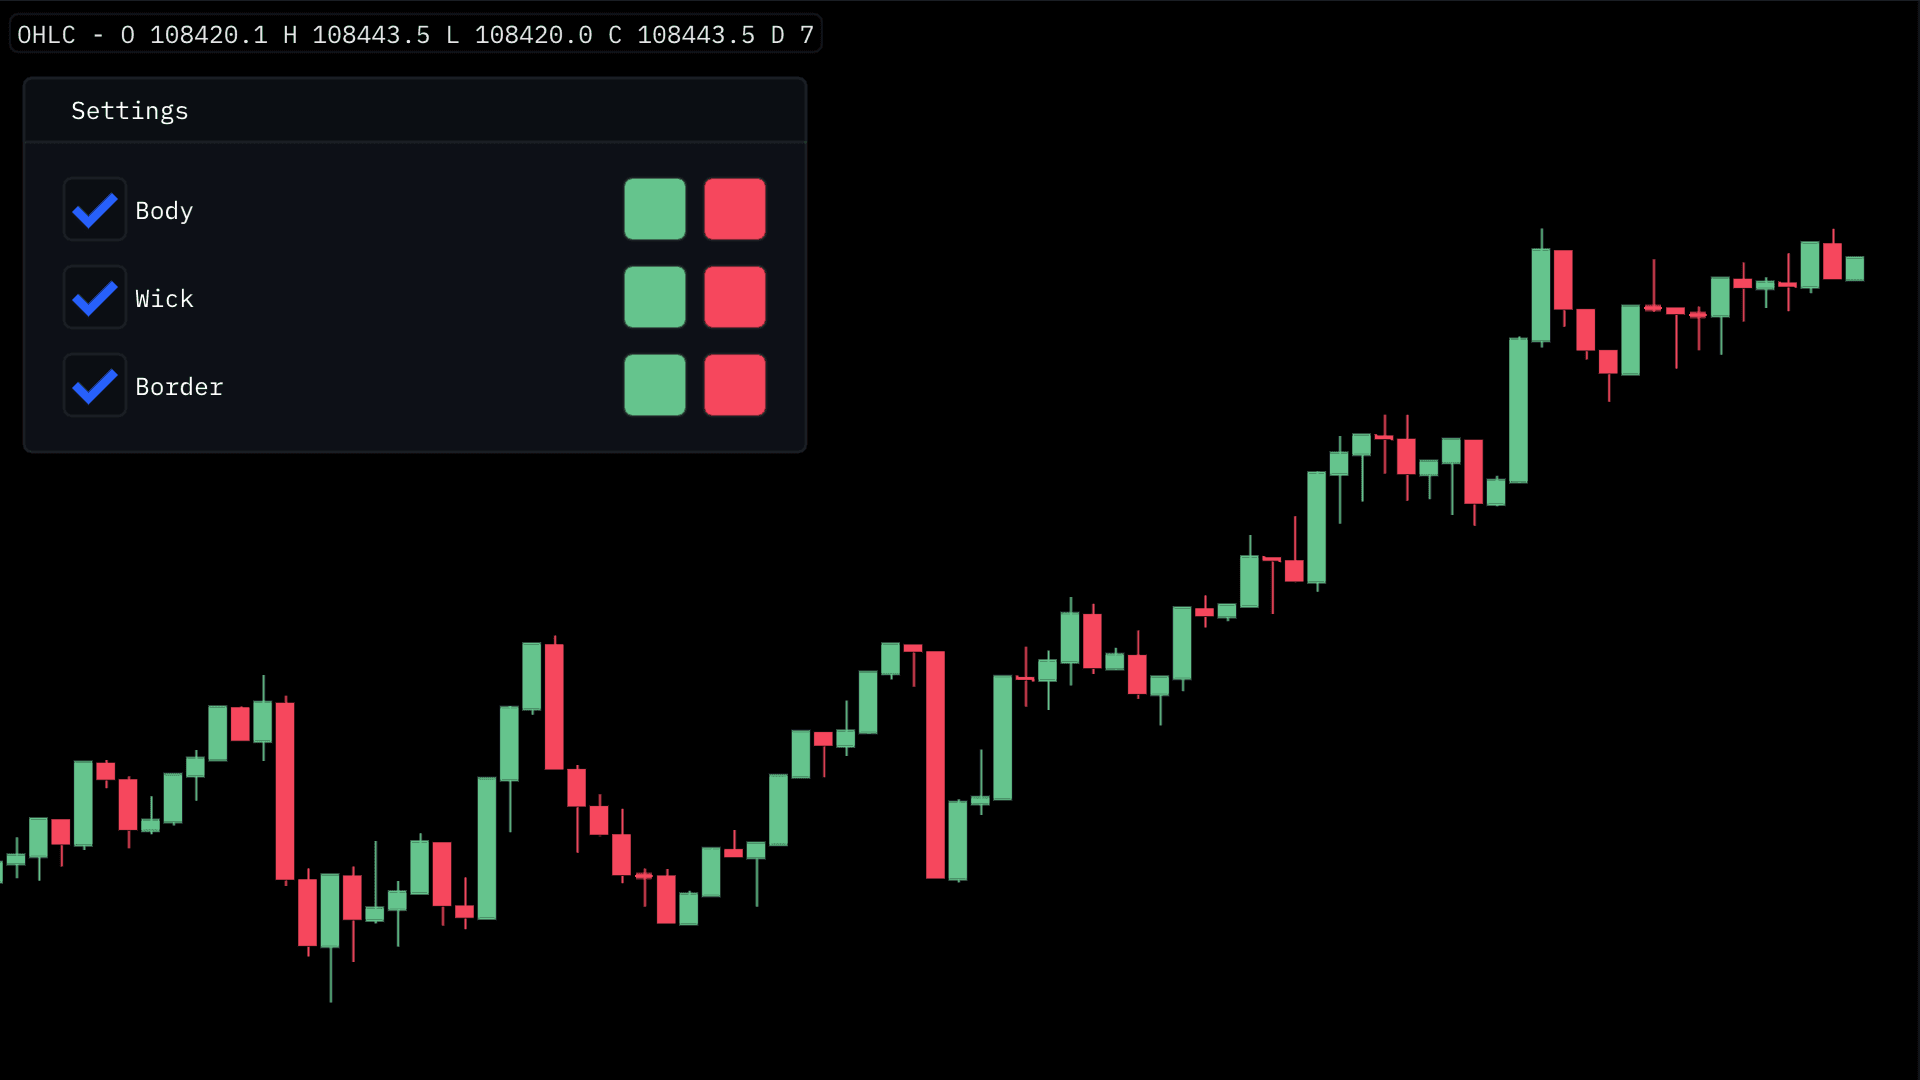
Each element within the candlestick layers can be modified to suit your preferences. Separating these Body, Border & Wick color pickers are independent from one another will also help with accessibility.
🚀 Binance Futures Majors Historical Order Flow
At MMT we subscribe directly to market data streams that are provided by each respective exchange. Once connection has been established, we collect, process, store and subsequently serve this market data to you via the terminal.
The one caveat to this however, is that market data is only available from when we initialized the connection to subscribe to market data for a particular pair. This means that data prior to the initial connection is not present on MMT.
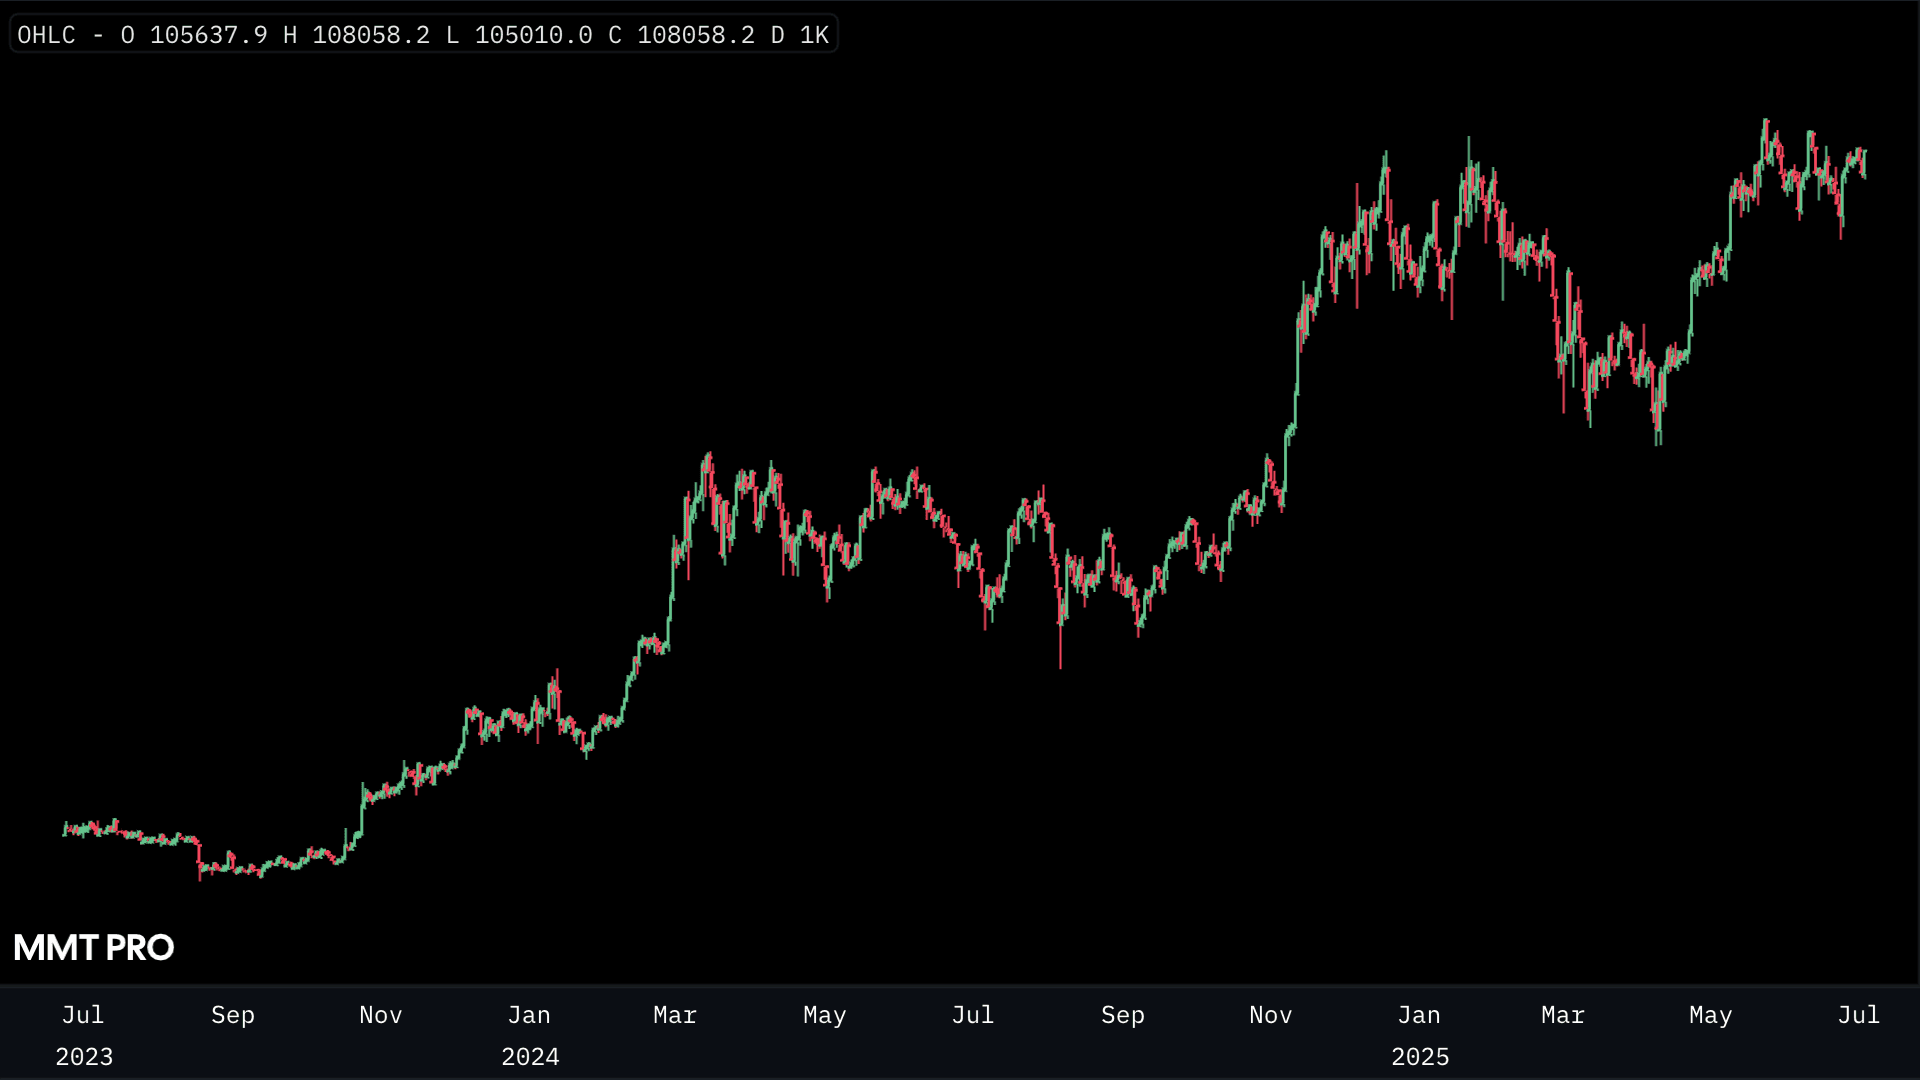
To begin to mitigate against this, we have backfilled majors data from July 2023 (BTC at 30k). This includes full order flow data from this date - allowing you full use of all the MMT order flows on this newly back-filled data.
The pairs that have had backfilled data include:
BTC - Bitcoin, ETH - Ethereum, SOL - Solana, BNB - Binance Coin, DOGE - Dogecoin
The processing time for each takes a little while to run so we will look to add more to this list over time.
Next up are XRP - Ripple, ADA - Cardano, LTC - Litecoin.
🚀 New Experimental Heatmap Rendering Styles
After the success of our blazing fast shader in the Heatmap v2.0 update a few weeks ago, the interns began to experiment with different possible rendering styles; Splat & Gaussian Splat.
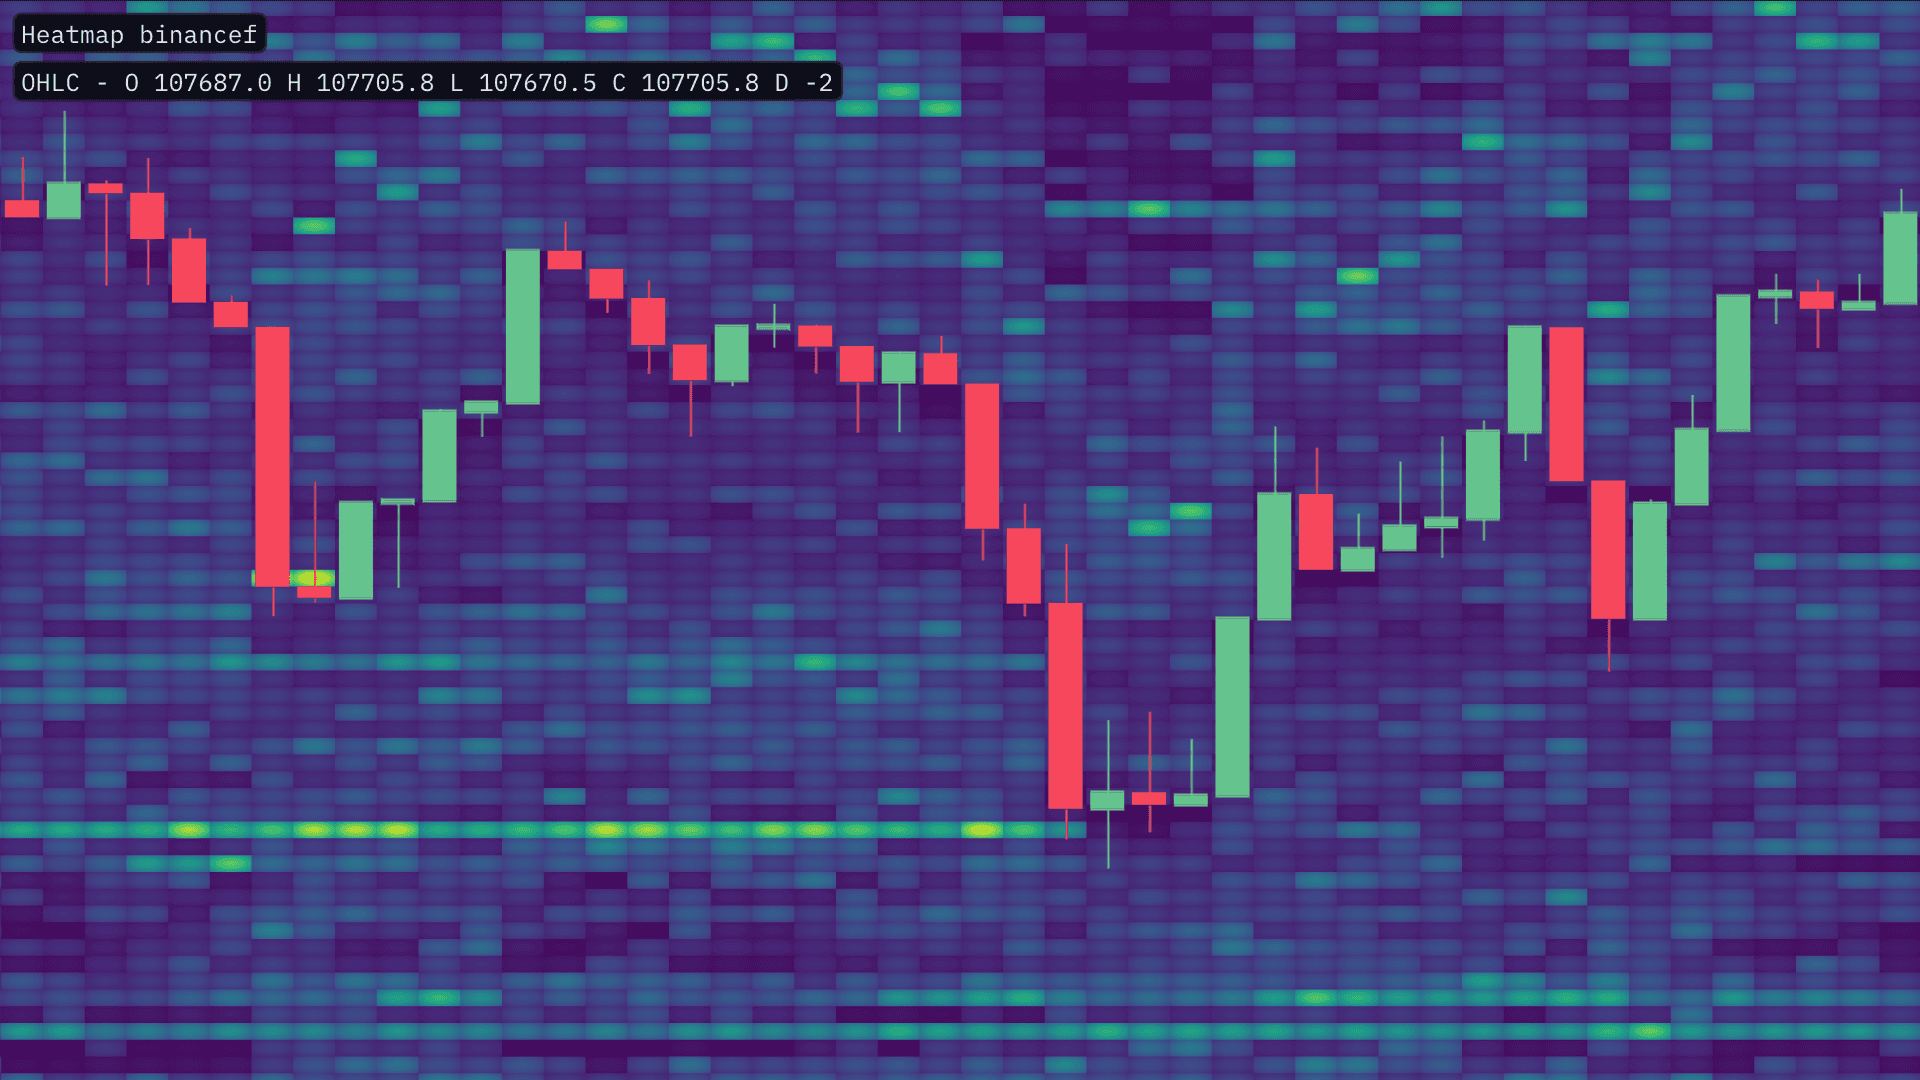
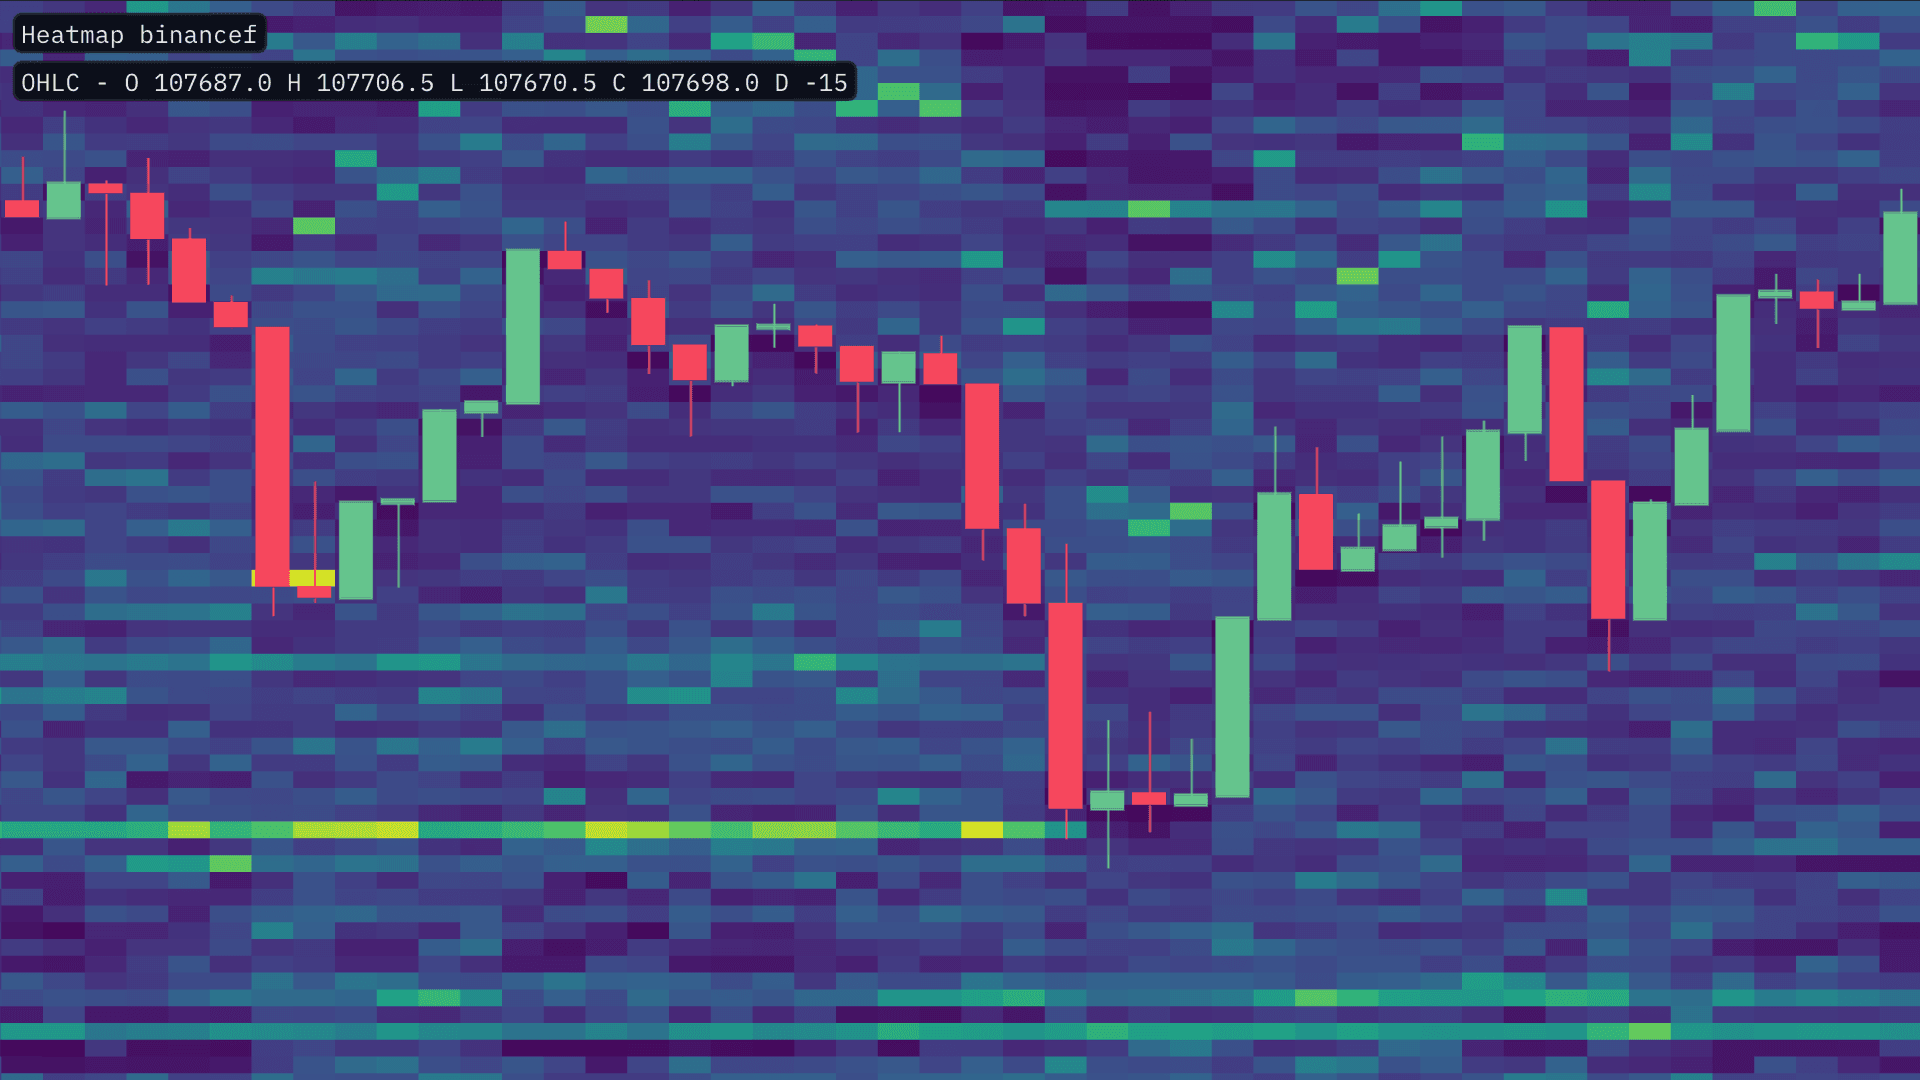
← Classic vs Splat →
Whilst the underlying Order Book data is the same across all MMT Heatmap rendering styles, the visual output of these new styles differs somewhat from the original 'Classic' style. These new styles provide slightly alternative visual outputs, particularly when assessing liquidity across larger ranges.
⭐️ New Heatmap Slider Inputs
After troubleshooting with some users, it quickly became clear that the Heatmap layer's Low and Peak inputs required a re-design. Following convention, we are happy to announce that this update brings a dedicated Heatmap Low and Peak slider input.
Each inputs is now situated within a single sliding range as opposed to the two separate inputs previously. Both the respective input are also accompanied by manual inputs, for more granular precision.
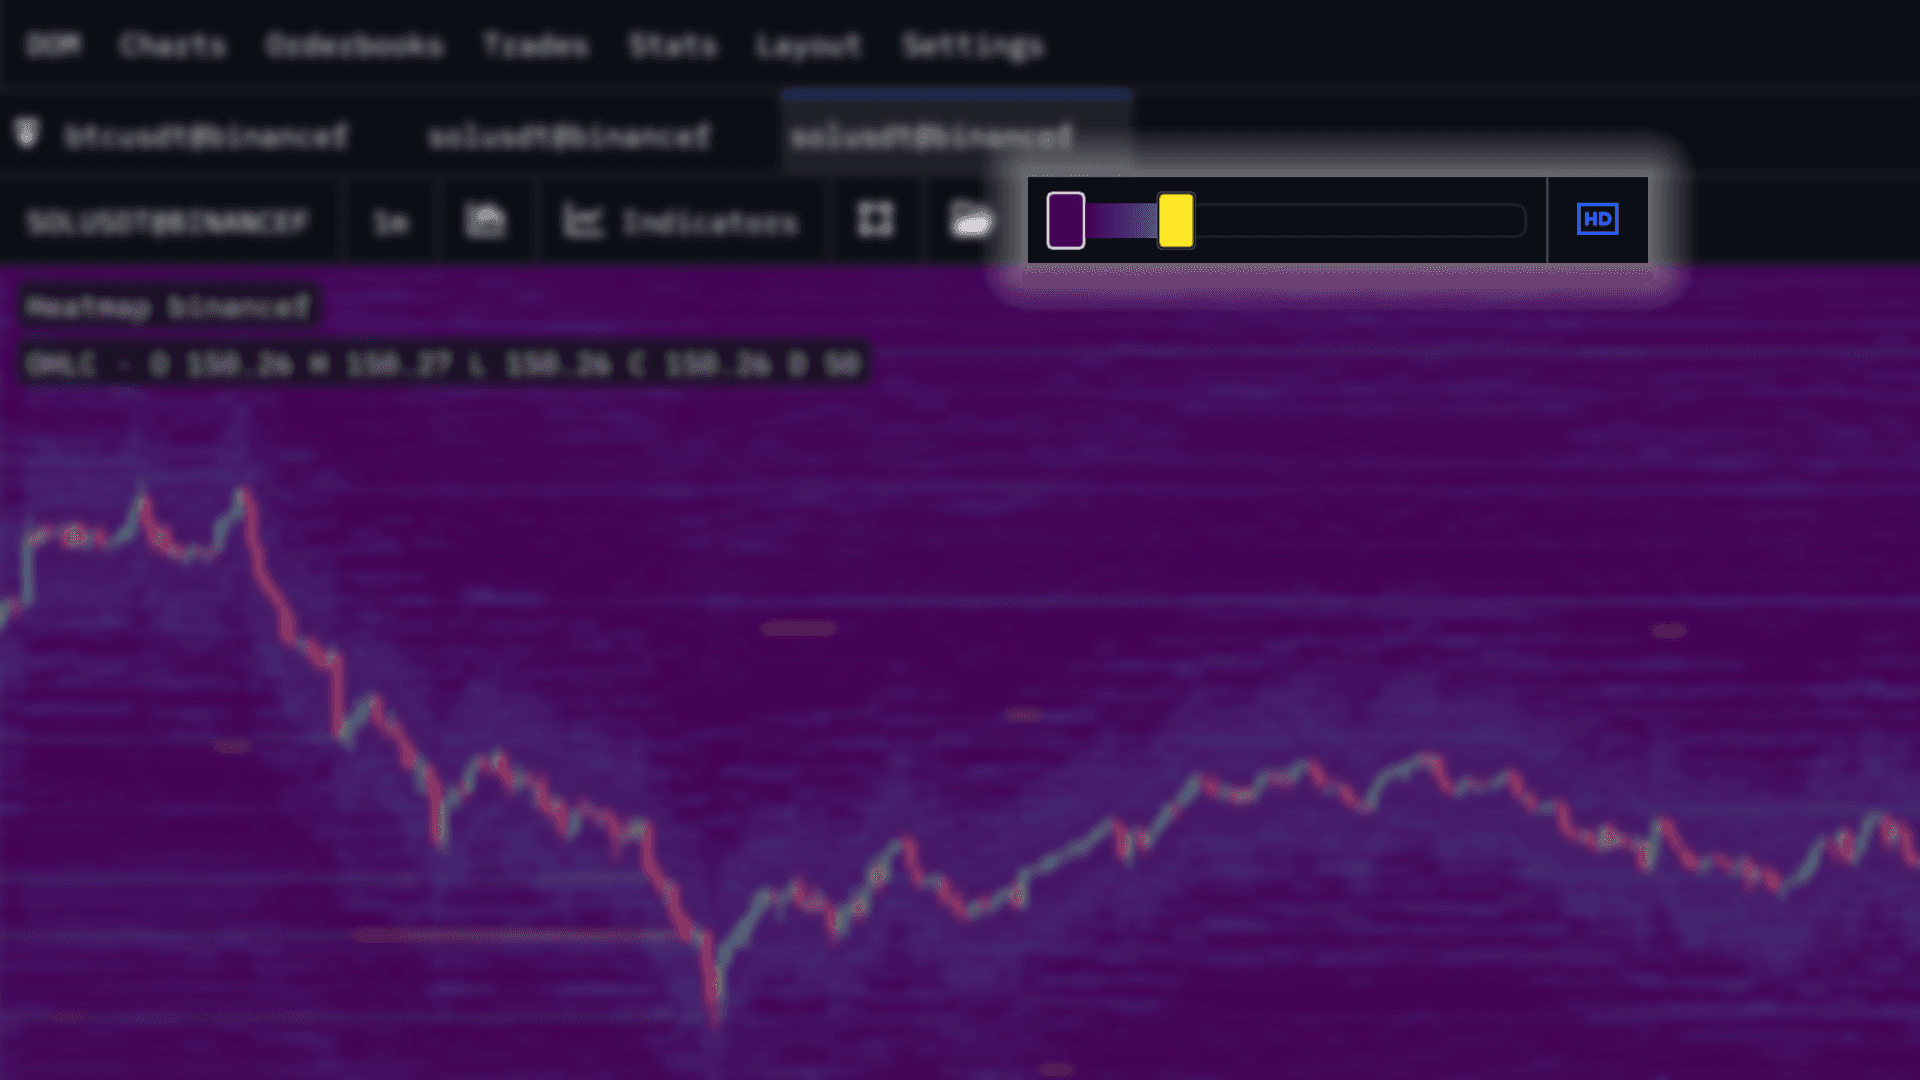
You will also notice that when the heatmap is activated, both the HD/SD toggle, along with the heatmap sliders will become part of your chart's UI. This allows easy quick adjustment on the fly without having to open the heatmap layer setting menu.
🚀 UI Improvements
⭐️ New UI Configuration Menus
As the tools and features are expanded rapidly on MMT, the UI wasn't quite keeping pace. For some layers such as TPO / Market Profile, we've iterated on a couple of occasions to best accommodate complex layers' full configuration options.
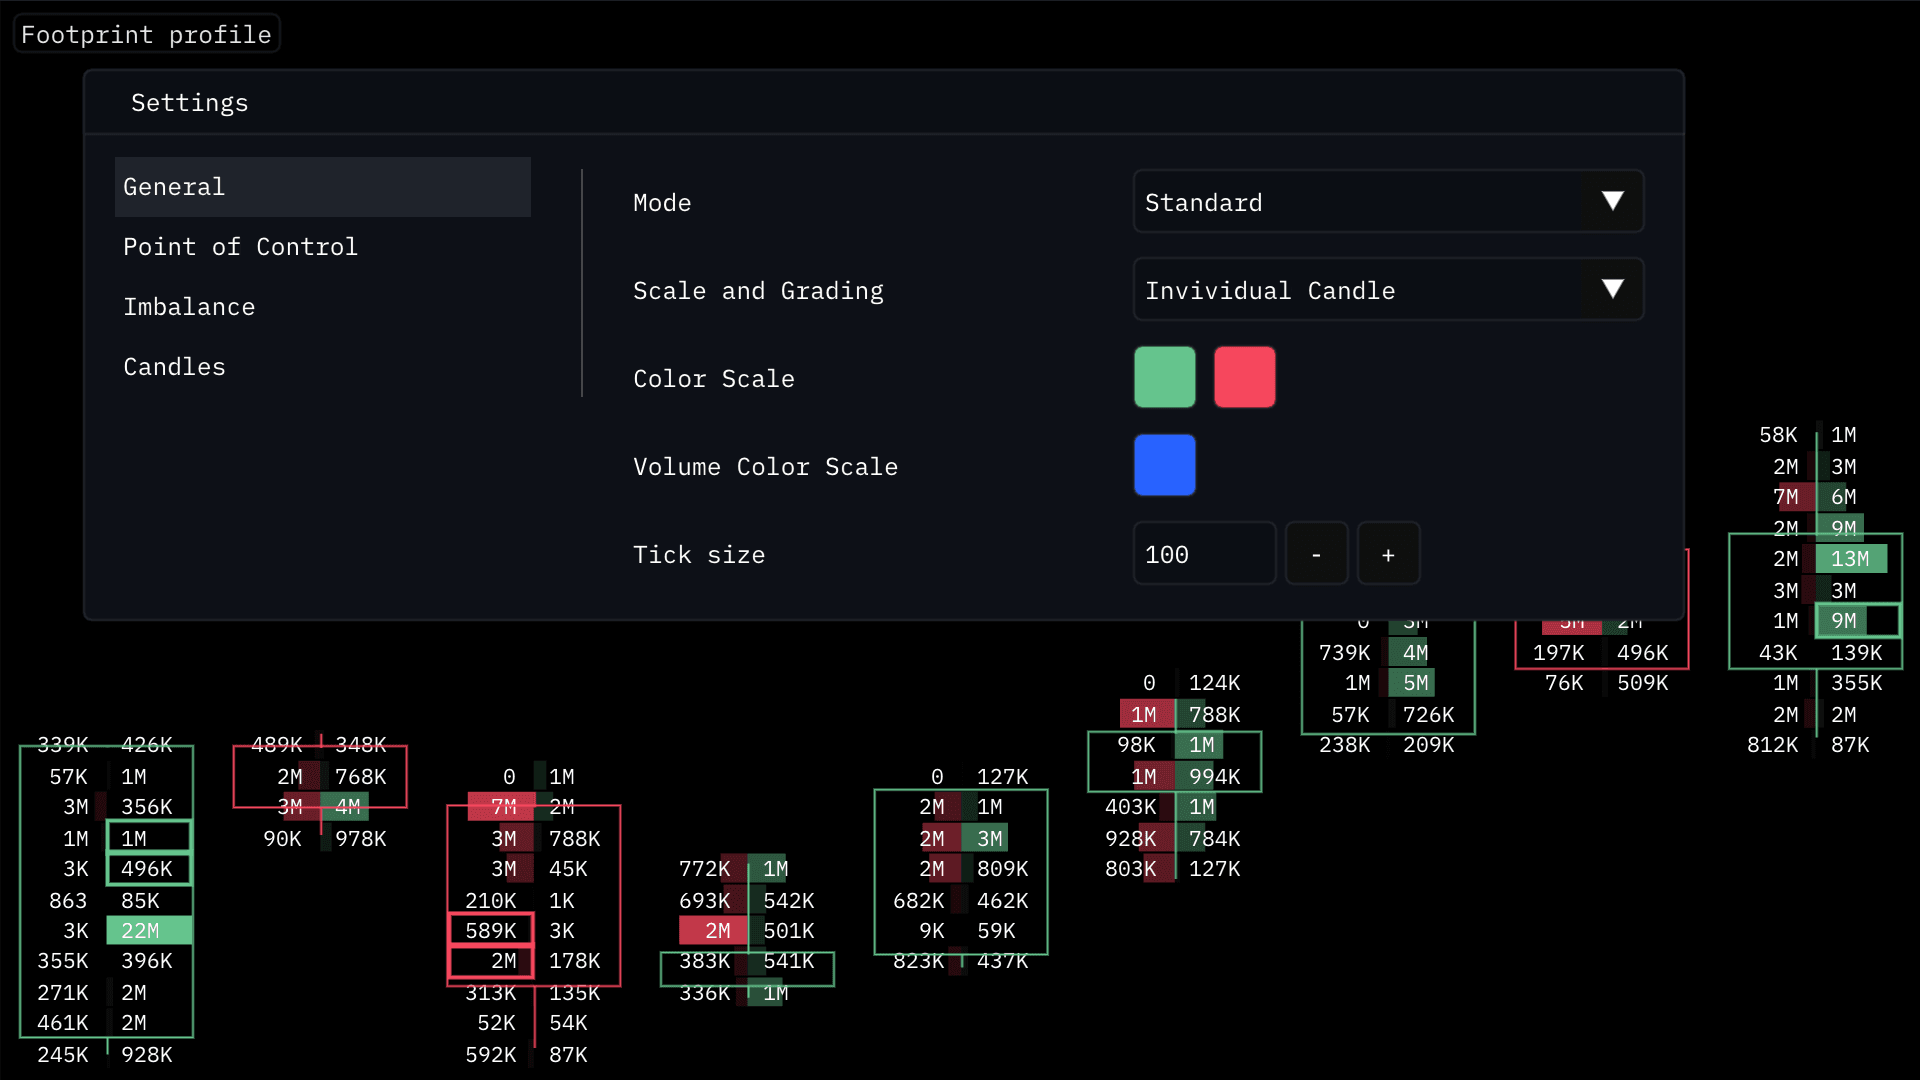
In this update, the latest iteration of this new tabbed menu has been applied to all layers where appropriate. This saves valuable screen space whilst also only presenting the sections of the configuration menu you are specifically interested in.
⭐️ Horizontal & Right Margin
Previously when your chart was idle with MMT, as new candles were formed, they were appended to the next. The issue with this was that historical candles would not shift along with each new candle. This would result in price continuing off screen.
This update fixes with with the new Right-Margin setting. Candles will now be shifted to always keep the current candle in view. This also applies to horizontal margins to keep scaled perspective when price is moving.
⭐️ Decimal Rounding of Large Values
Within 'Settings' at the top of your terminal, the 'Round decimals for sizes' would convert values such as 12.314 to 12 to allow easier visual comparison between data points.
← Non-Rounded vs Rounded →
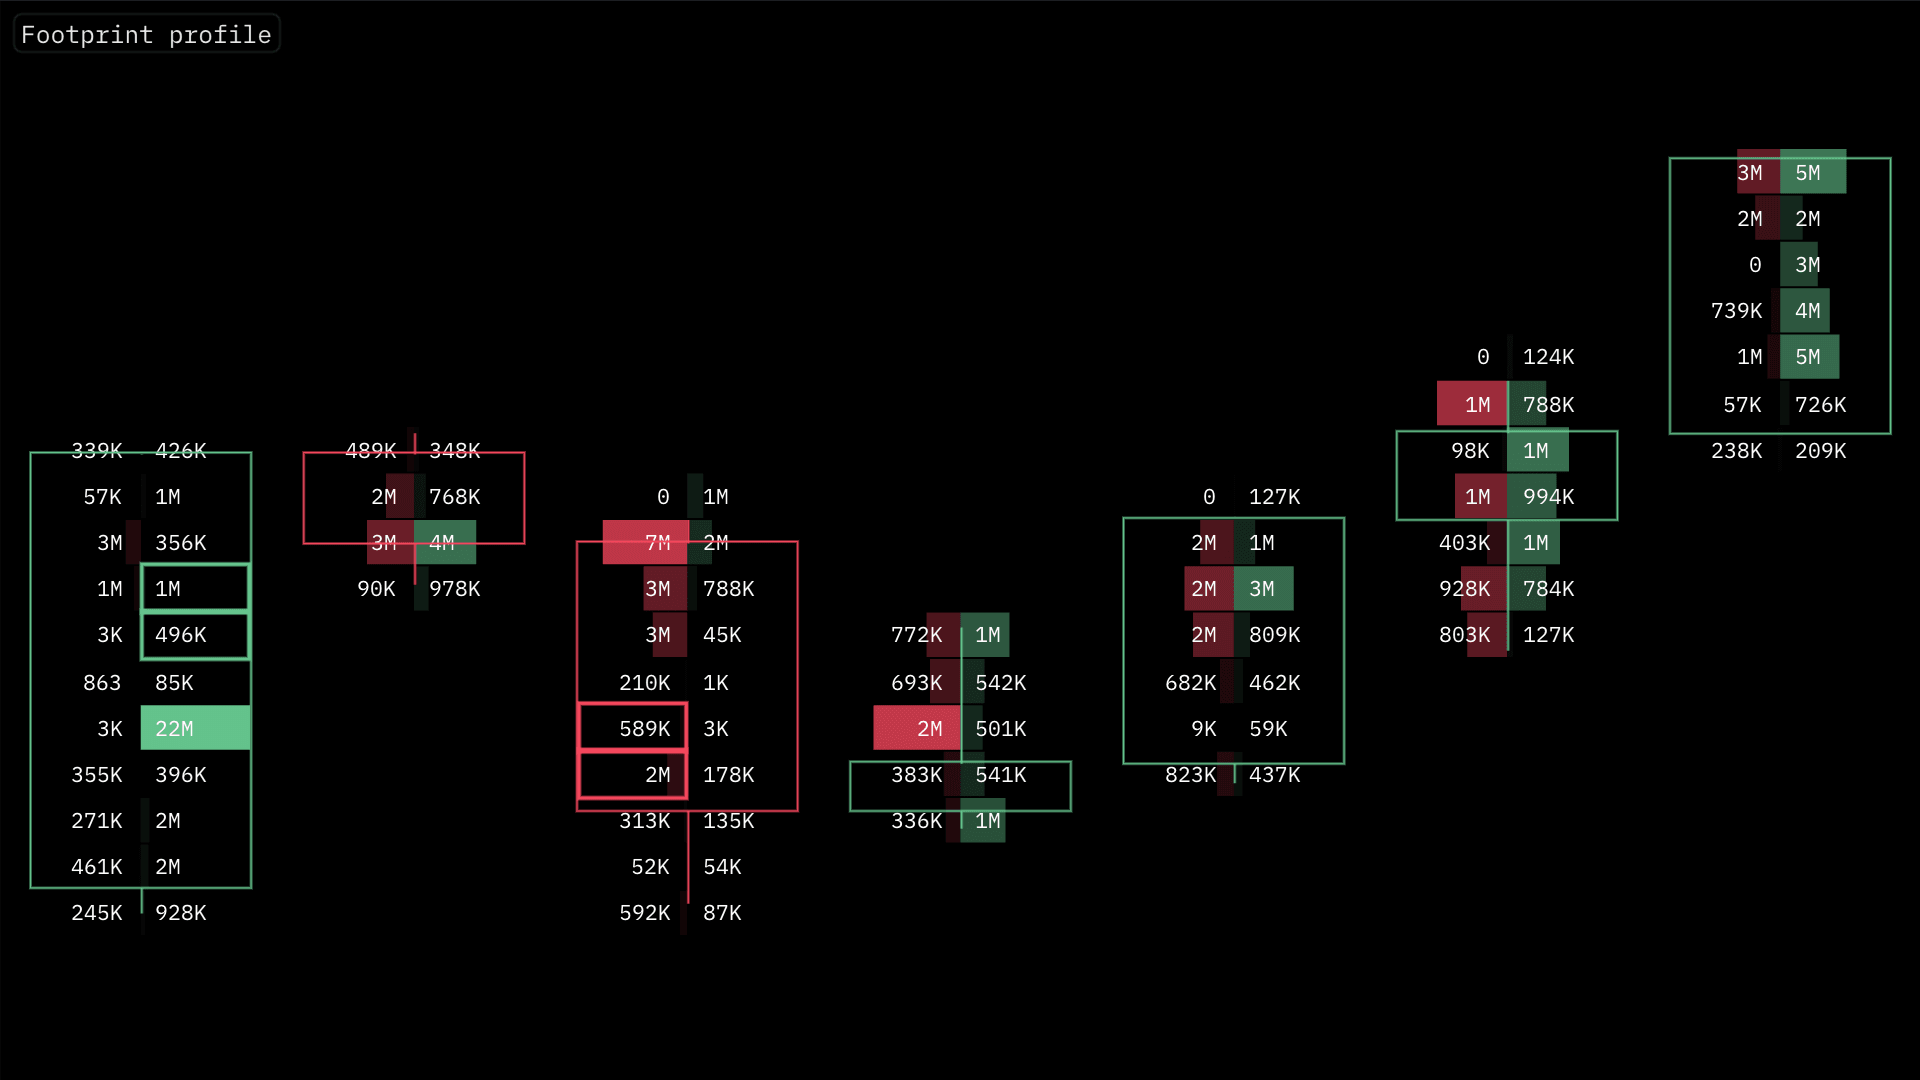
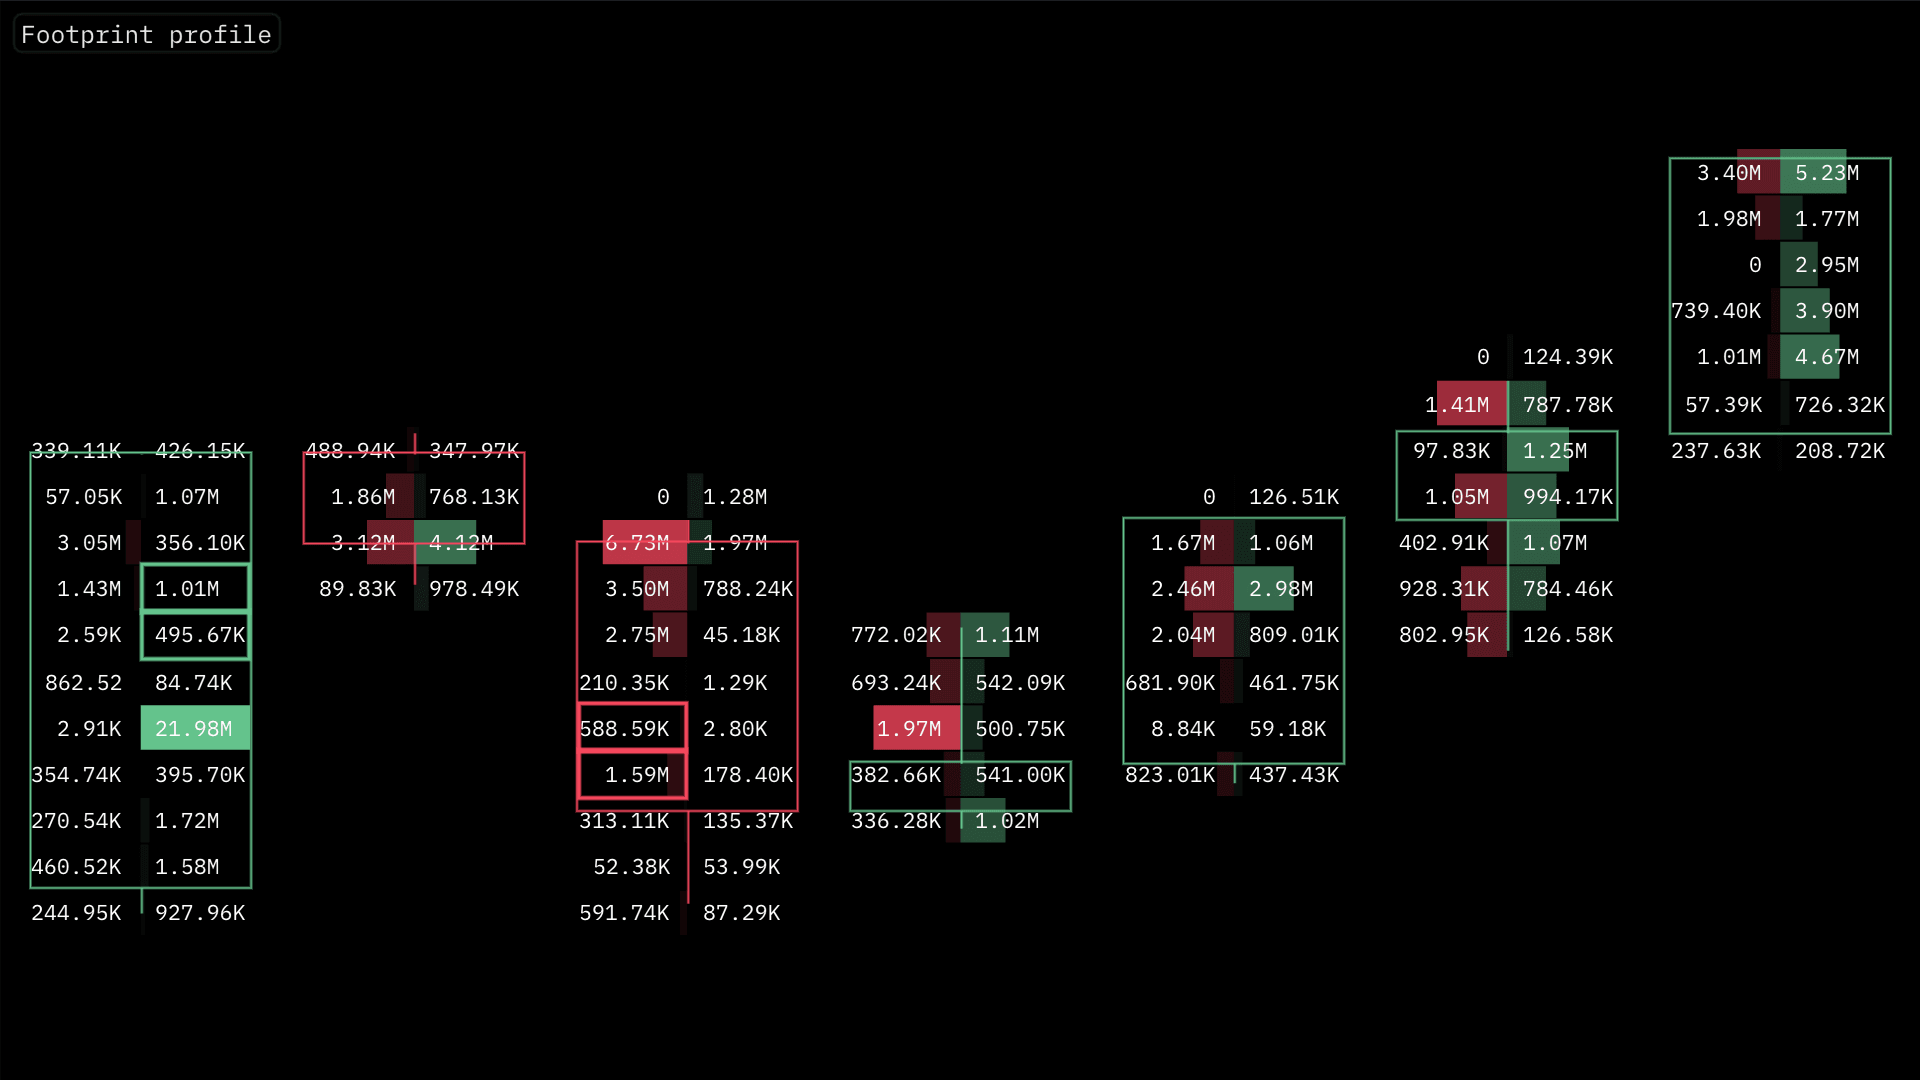
In today's update we have extended this functionality to also include larger values. Now when enabled, values such as 98.76 K will now be displayed as 99 K. This also solves a slight value rendering issue with the Footprint Profile view - particularly when examining inverse perpetuals. As a reminder you can activate this setting by going to 'Settings' → 'Round Decimals'
⭐️ USD / COIN Value Selection
By default Market Monkey will use the unit value that is ascribed to the pair by the exchange. For most spot/linear BTC markets, this will mean that market data is denominated in BTC. Although this means that values are usually small enough (particularly in BTC markets) to compare with one another, assessing comparisons with USD denominated inverse pairs make such comparisons more difficult.
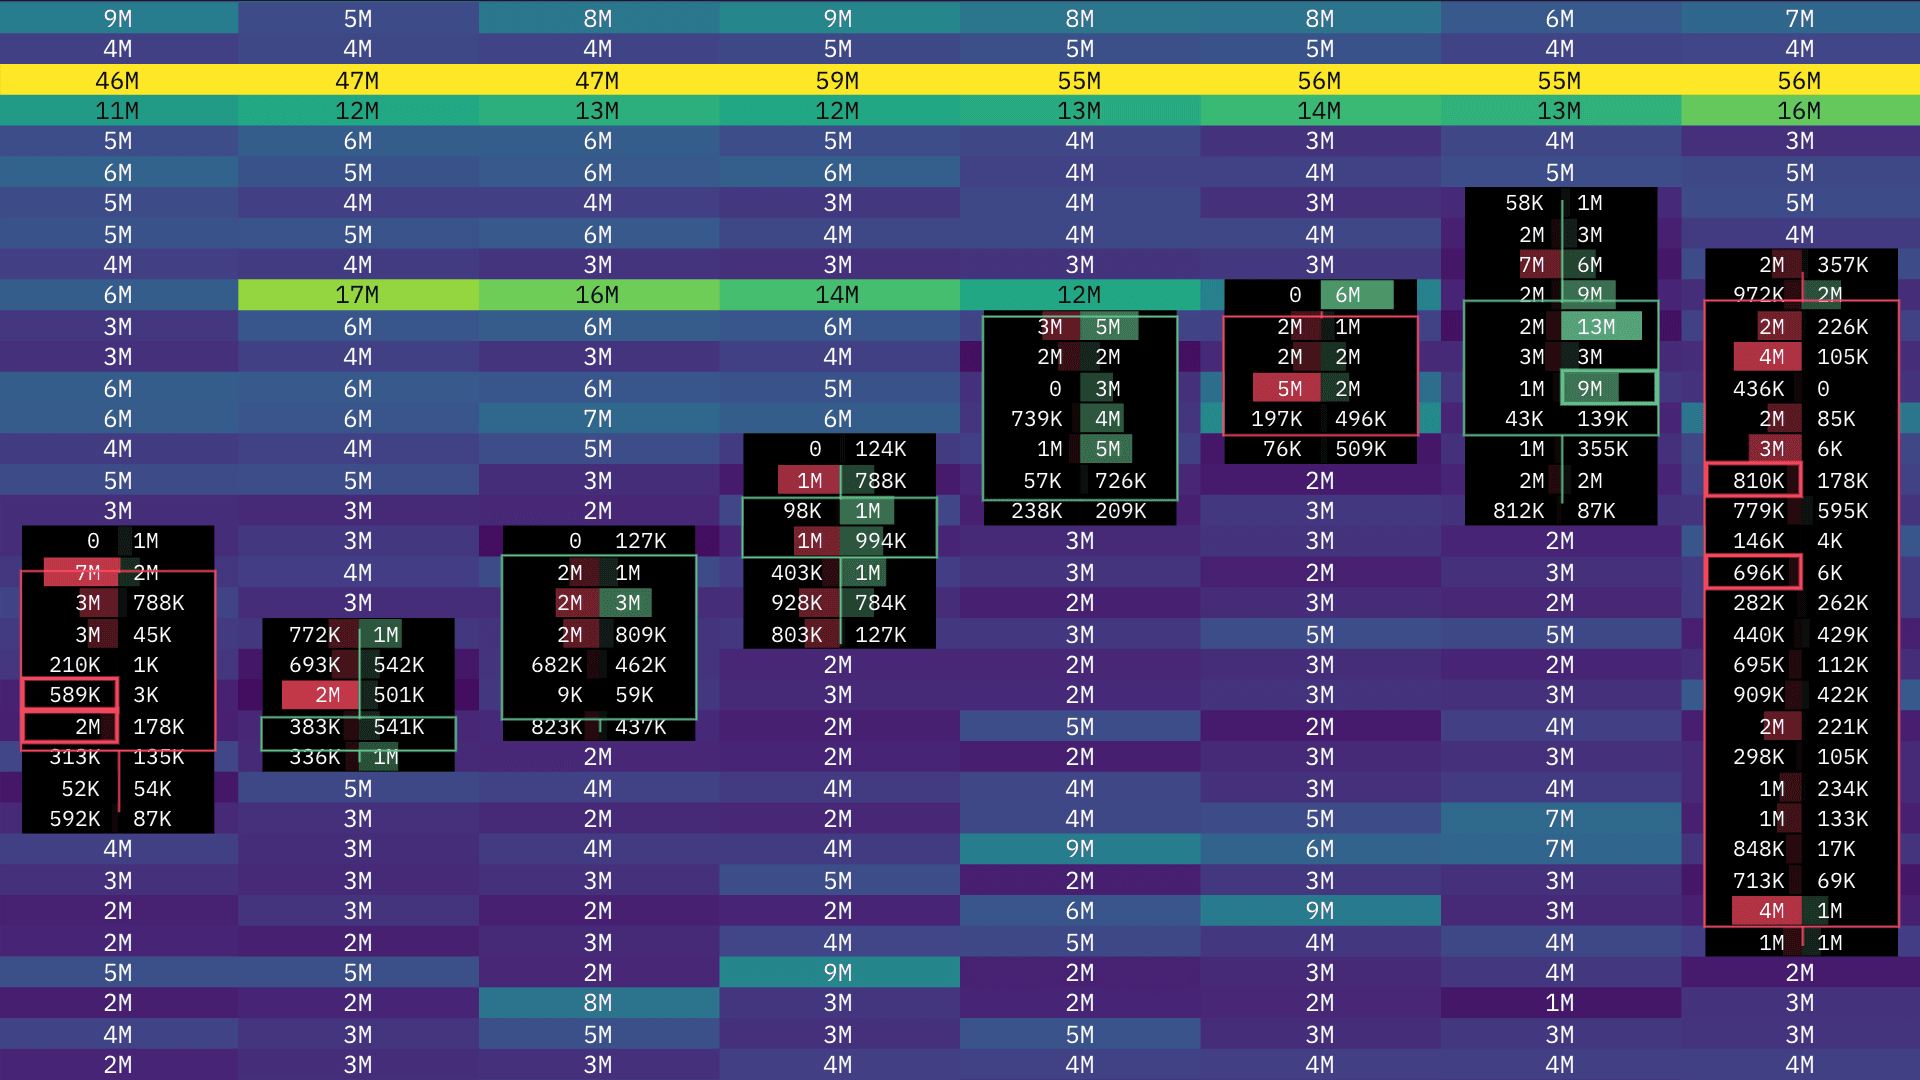
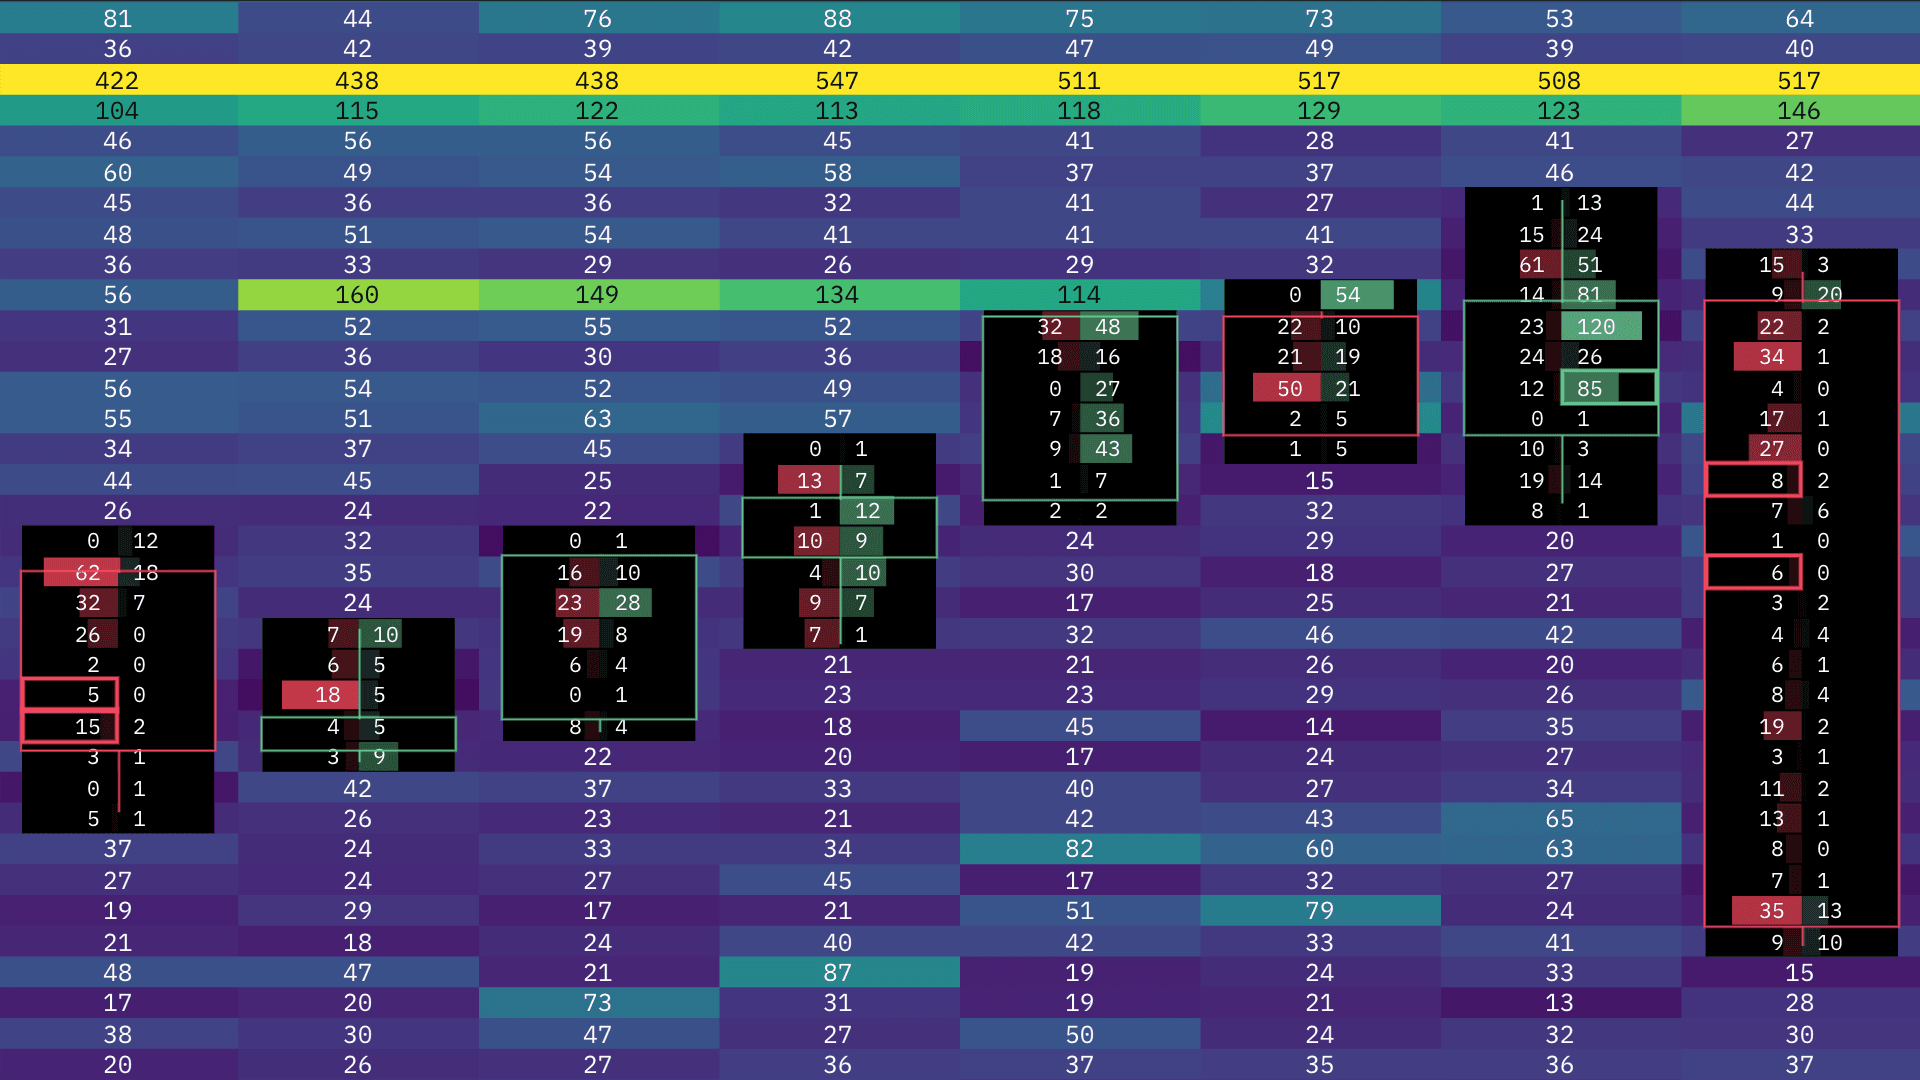
← COIN vs USD →
In today's update we have implemented an experimental new unit value input selector. Whether USD or COIN, comparing market data points will now be easier, regardless of the of market that is being examined. At this stage the following widgets and layers are included:
Widgets: DOM, Chart*, Trades
Chart Layers: Heatmap, Footprint, TPO's (Volume Profile)
⚠️ *As this option is in its experimental phase, this USD / COIN value selection is not applied everywhere within MMT.
Providing there are no issues with the above, we will look to expand this configurable unit value to all elements within MMT.
⭐️ Pair & Exchange Widget Titles
This update removes the widget IDs that used as titles. It was a remnant from a previous update that was a pesky to resolve without a more involved refactor under the hood.
Before:
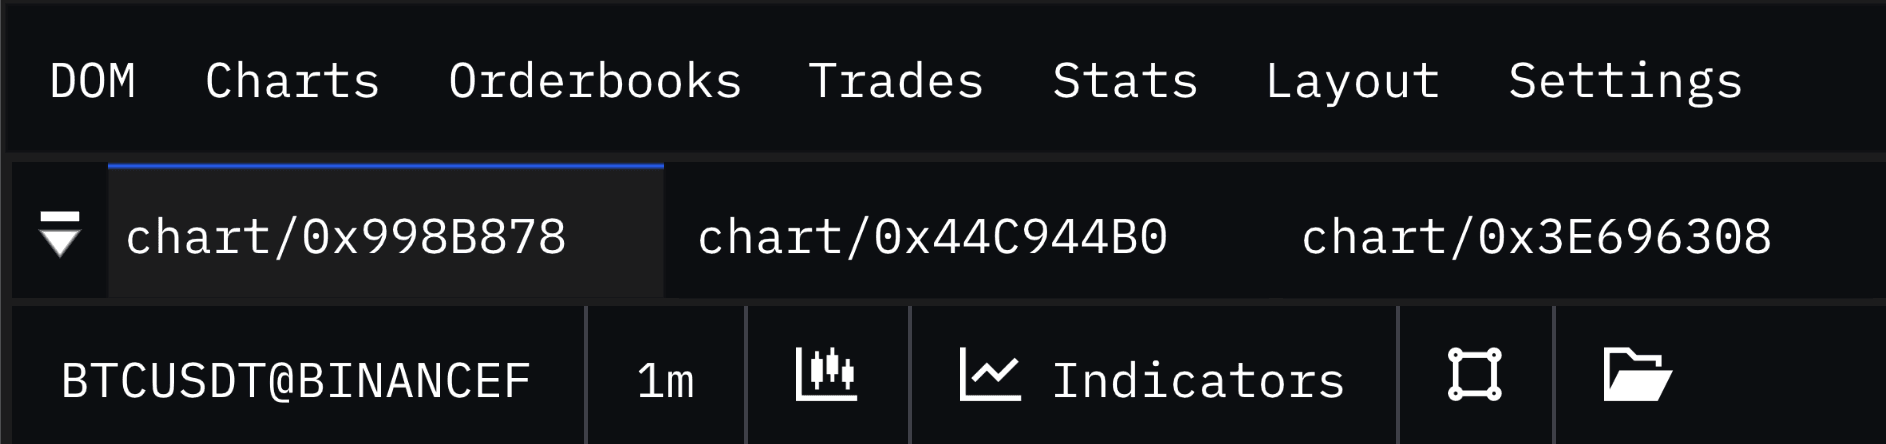
Now:
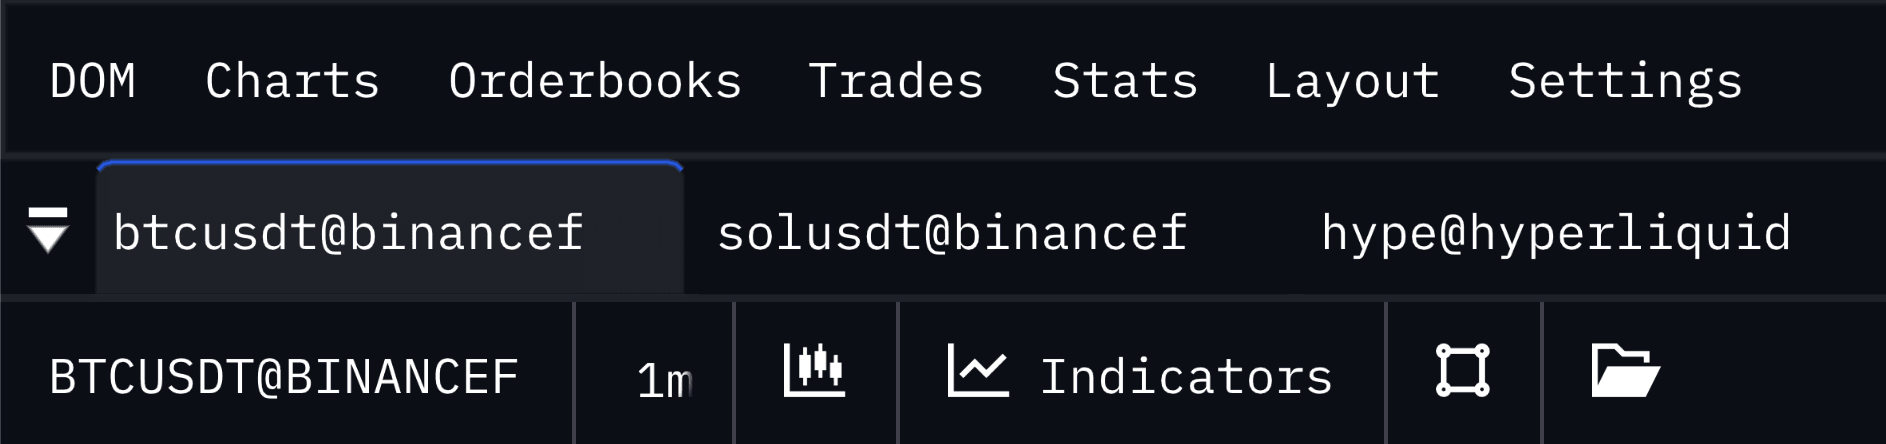
Happy to share that the titles are far more readable and manageable in today's update. Whilst these title are naturally a vast improvement, like other UI elements, we will still look to improve further over time.
⚠️ Please Note: Any current widgets you had prior to this update will still have their original ID. Due to a migration conflict only newly created widgets/charts will have their tab title reflect the selected market.
🏗️ Coming Soon
⭐️ New Exchanges & New Pairs
Next up is the integration of Bitfinex, Bitmex & Deribit market data within MMT. We will look to expand our market coverage across all exchanges to aim to include the top 100 coins by market capitalization over the next few batches. From this we will also include further exchange integrations in future.
⭐️ Aggregated Market Data
Just like our aggregated heatmaps, we are currently working on the process of aggregating all possible data sources on Market Monkey. This will include aggregated volume, CVD, Open Interest, etc.