VPVR - Volume Profile Visible Range
Introduction
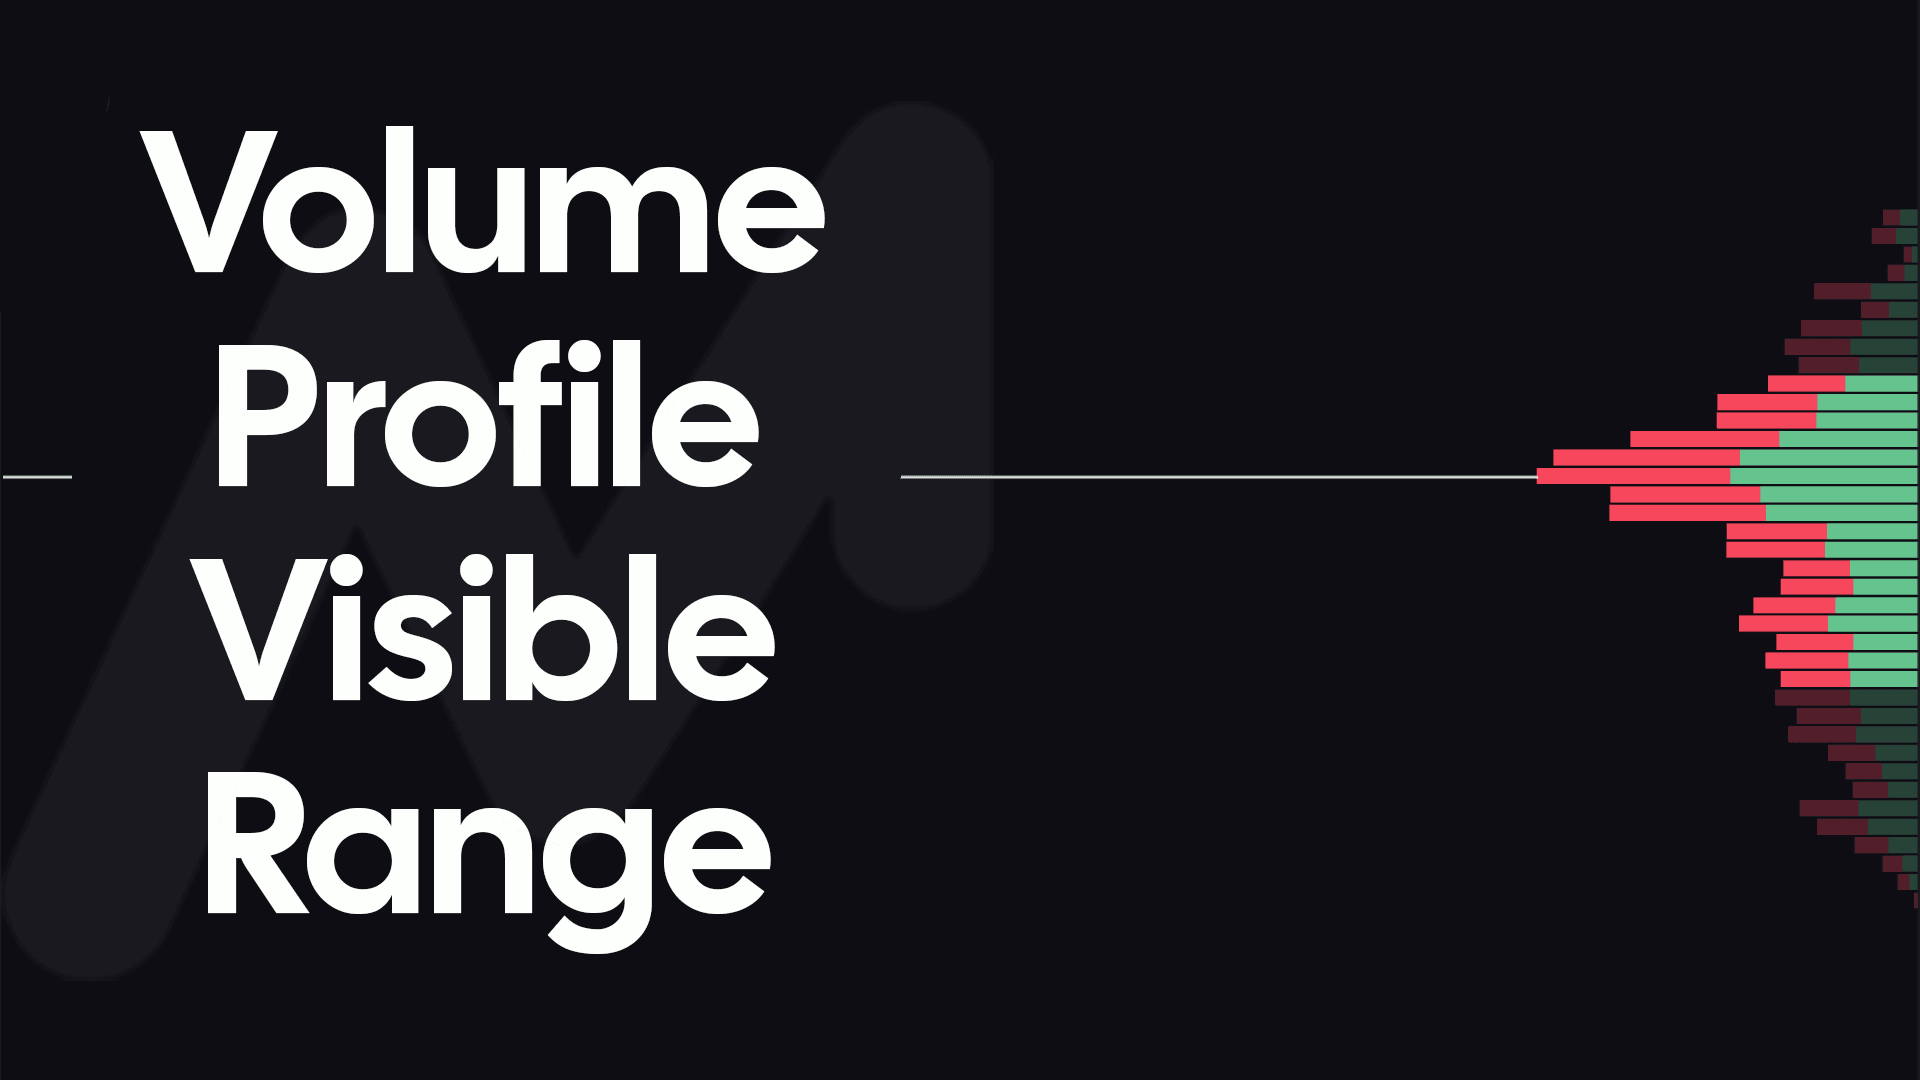
Traditional tools such as volume measure market buy & market sell over a period of one candle. One drawback of this is that it is difficult to determine the where, or at which prices locally, volume was transacted. This is where the VPVR or Volume Profile Visible range is particularly useful.
When price moves, VPVR visually renders in real-time where exactly the volume of market buys & market sells, is being distributed. For each candle within view (Visible Range), this buy & sell distribution is recorded and totalled across each price grouping to collectively produce a volume profile. Particularly valuable within ranging markets, the VPVR also produces a range of other data points upon aggregating market order data, including the Point of Control, the Value Area range, and their respective Value Area High and Value Area Low.
VPVR Elements
Whilst we introduced some VPVR concepts above in the introduction, let's explore them in more detail below.
Volume Profile
The profile's appearance is formed by the overall collection of each row of the VPVR. As volume is traded between price levels, VPVR will total and distribute market buy & market sell volume between these rows. Importantly, the height of each row indicates the price grouping (or increments in price). This grouping of prices for each row can be adjusted via the Tick per Row input (see below).
Point of Control - POC
Of all the rows of the profile, the widest row signifies were the most volume was transacted over the period of time currently within your view.

This row is considered as the Point of Control (often abbreviated to 'POC'). As this is where the largest volume was executed it is considered the "fair-price" over the period visible on your chart. This Point of Control price is often re-tested particularly in ranging markets.
Value Area
After the Point of Control is determined, the value area can be calculated. The Value Area is the price range in which 68% - one standard deviation - of the total traded volume occurred. Originating from the Point of Control, each row above and below is compared to determine which has the greater amount of volume. This row is then included within as part of the Value Area. This process repeats, expanding outwards from the Point of Control until 68% of the total volume traded over the range has been accounted for.

Value Area High - VAH & Value Area Low - VAL
The Value Area High and Value Area Low are respectively the very high and very low of the Value Area's price range. Whilst perhaps not as statistically as significant as the Point of Control, these VAH and VAL prices can often can see a reaction if visited by price in the future. This is as trading outside of the Value Area is considered 'poor value'.
VPVR Modes
There are three VPVR modes to choose from within the Market Monkey Terminal. Whilst the elements explained such as Point of Control and Value Area will not be altered regardless of the VPVR mode chosen, the visual aspects of the profile will change. Below we will explain each mode in detail.
Standard Mode
So far in this article, we used the default 'Standard' VPVR mode. Stacked horizontally, each row of the VPVR contains two distinct colors.
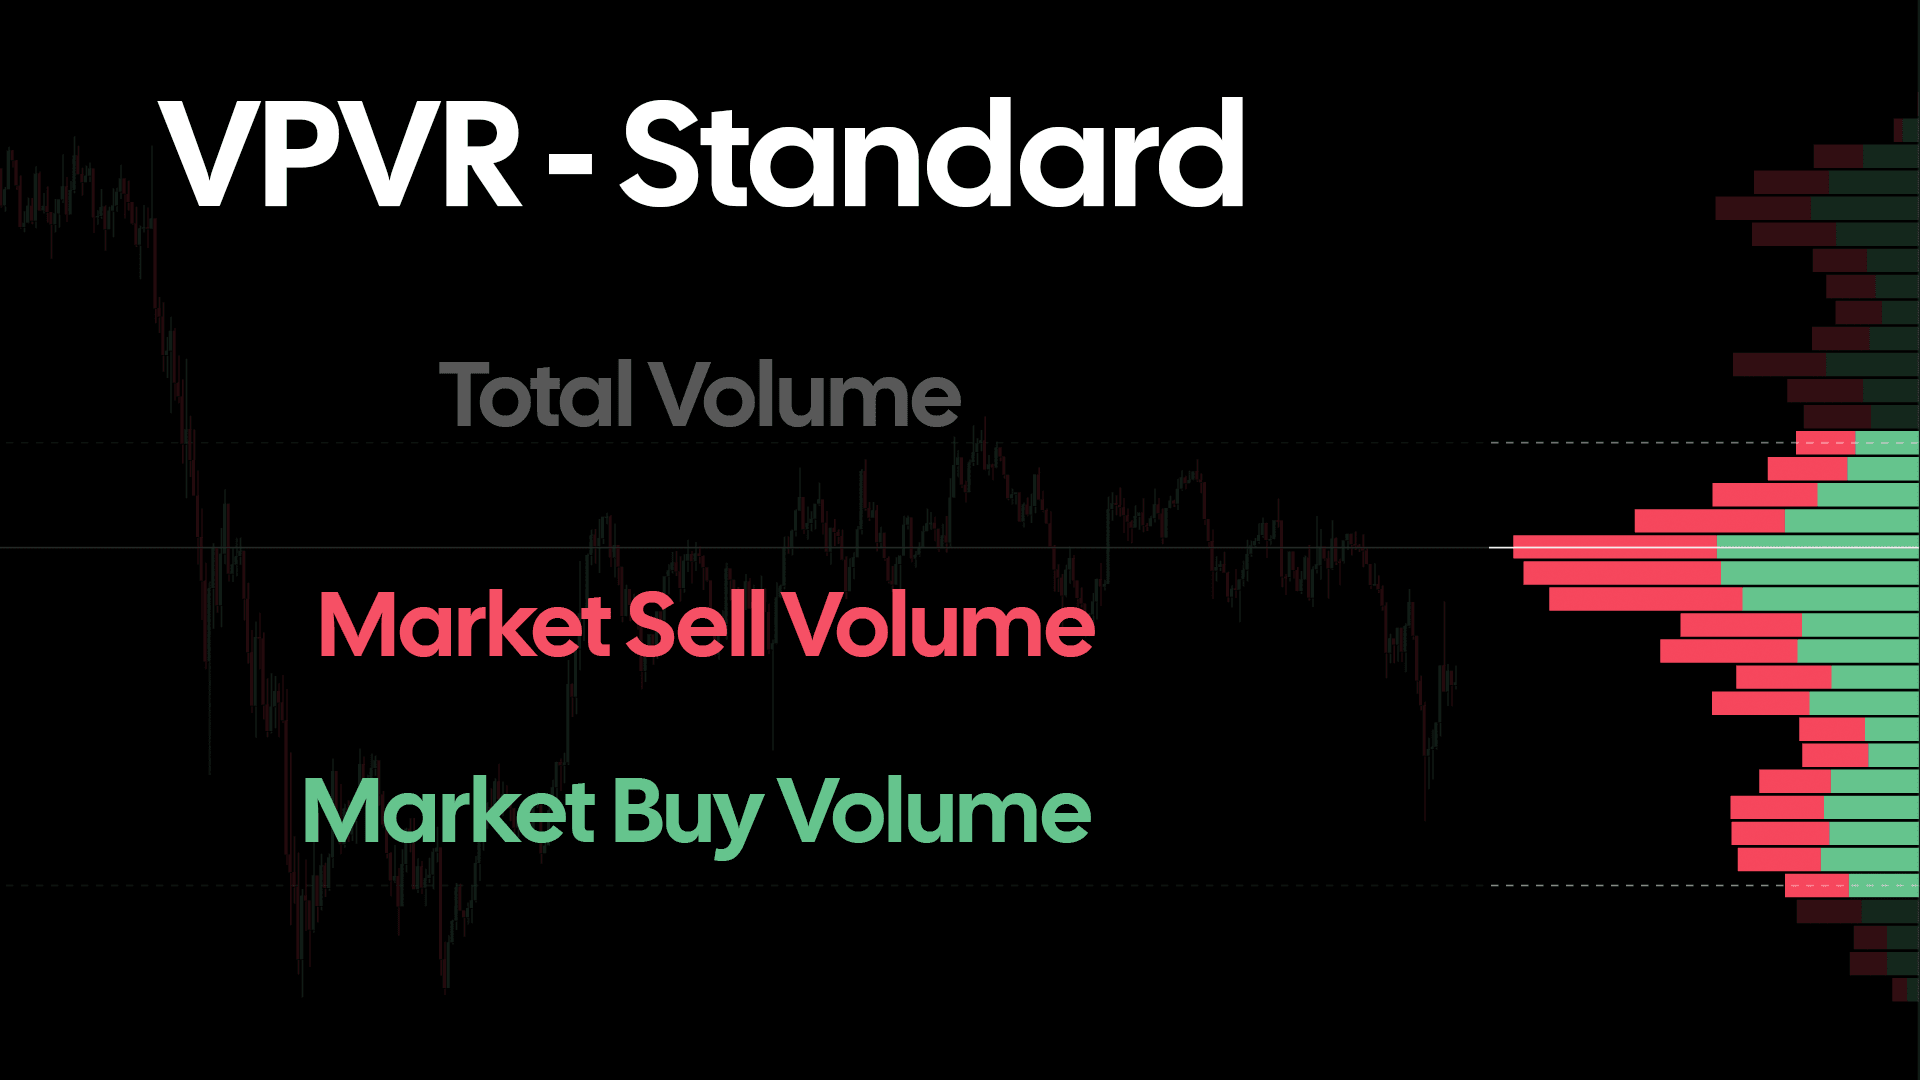
Market Buy Volume volume is shown in green, with market sell volume shown in red. The wider each respective section, the greater value of respective market buy or market sell volume that was transacted.
Total Volume
When 'Total Volume' mode is selected, both market buy volume and market sell volume are summed together to produce the total volume traded at each price level.
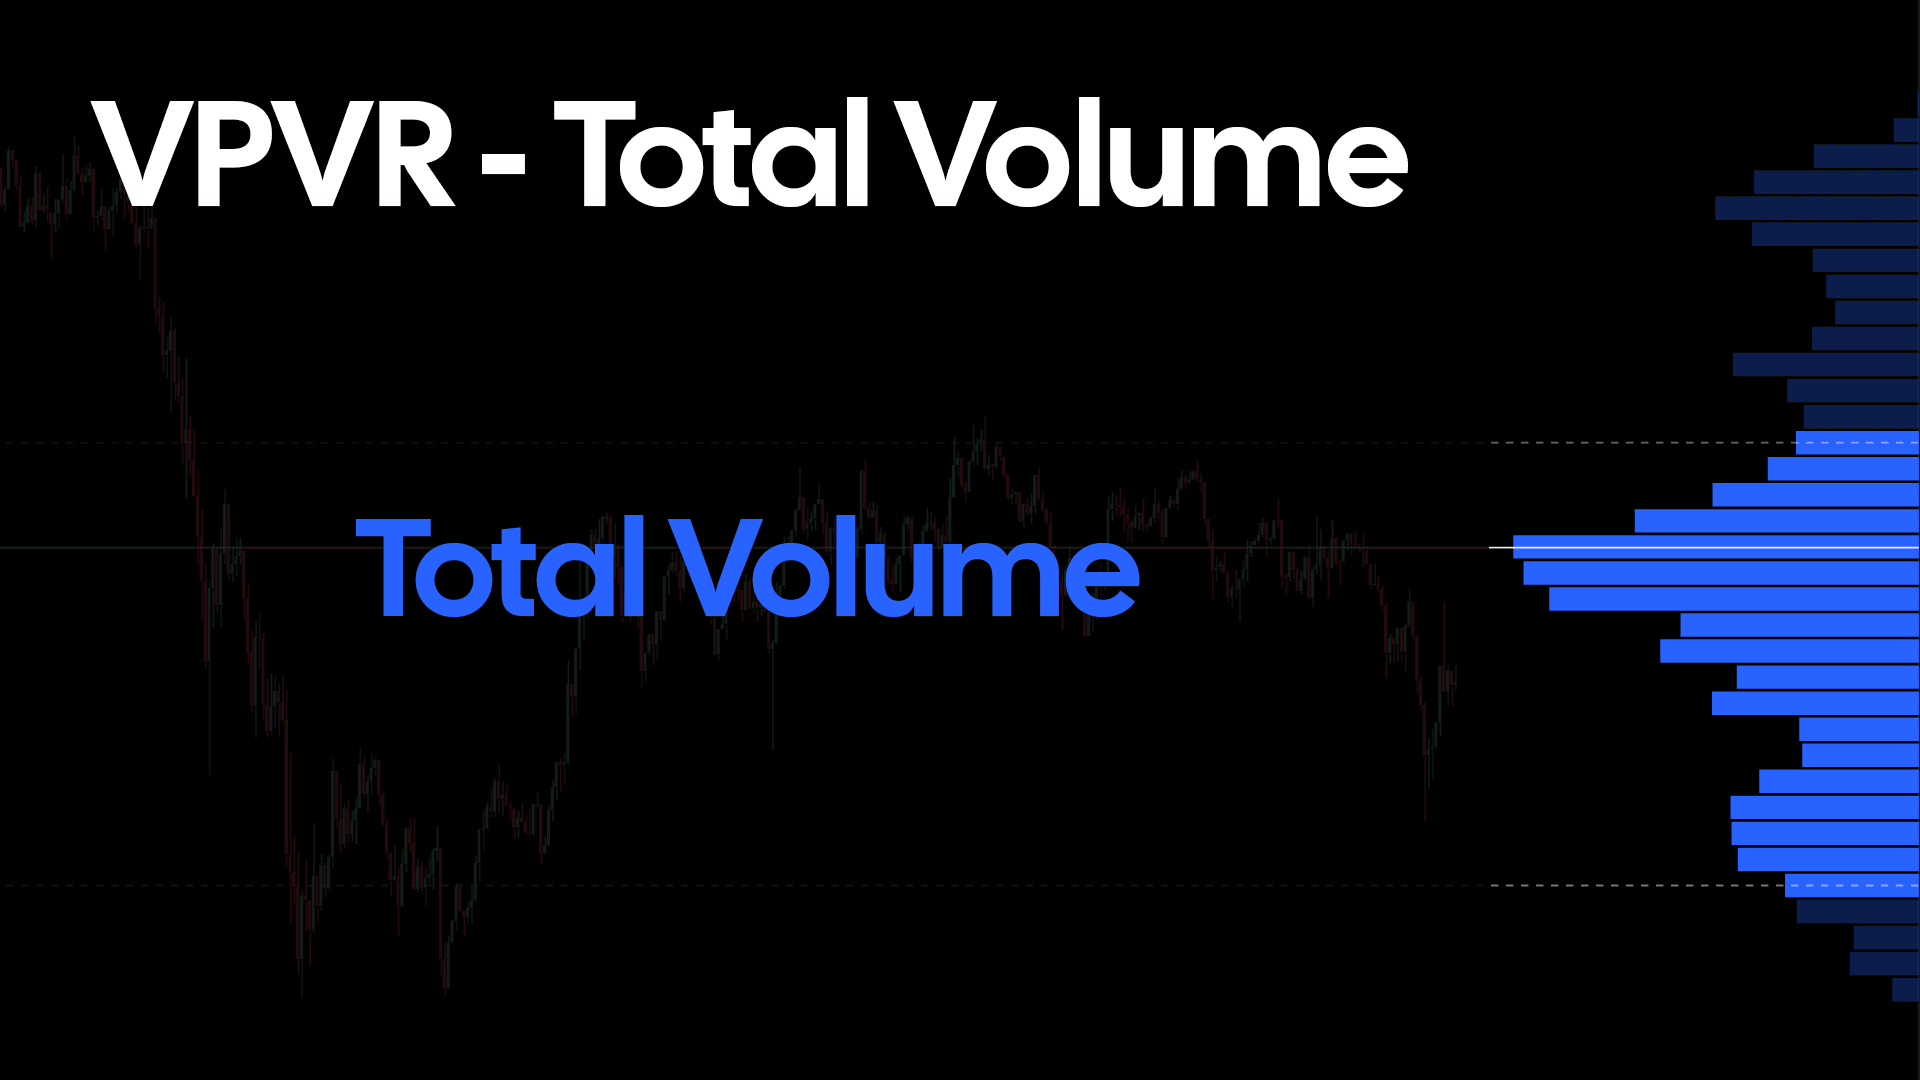
This renders each row within the profile as one uniform color. By default this is rendered in blue. The width of the row represents the total volume that was traded at that price range.
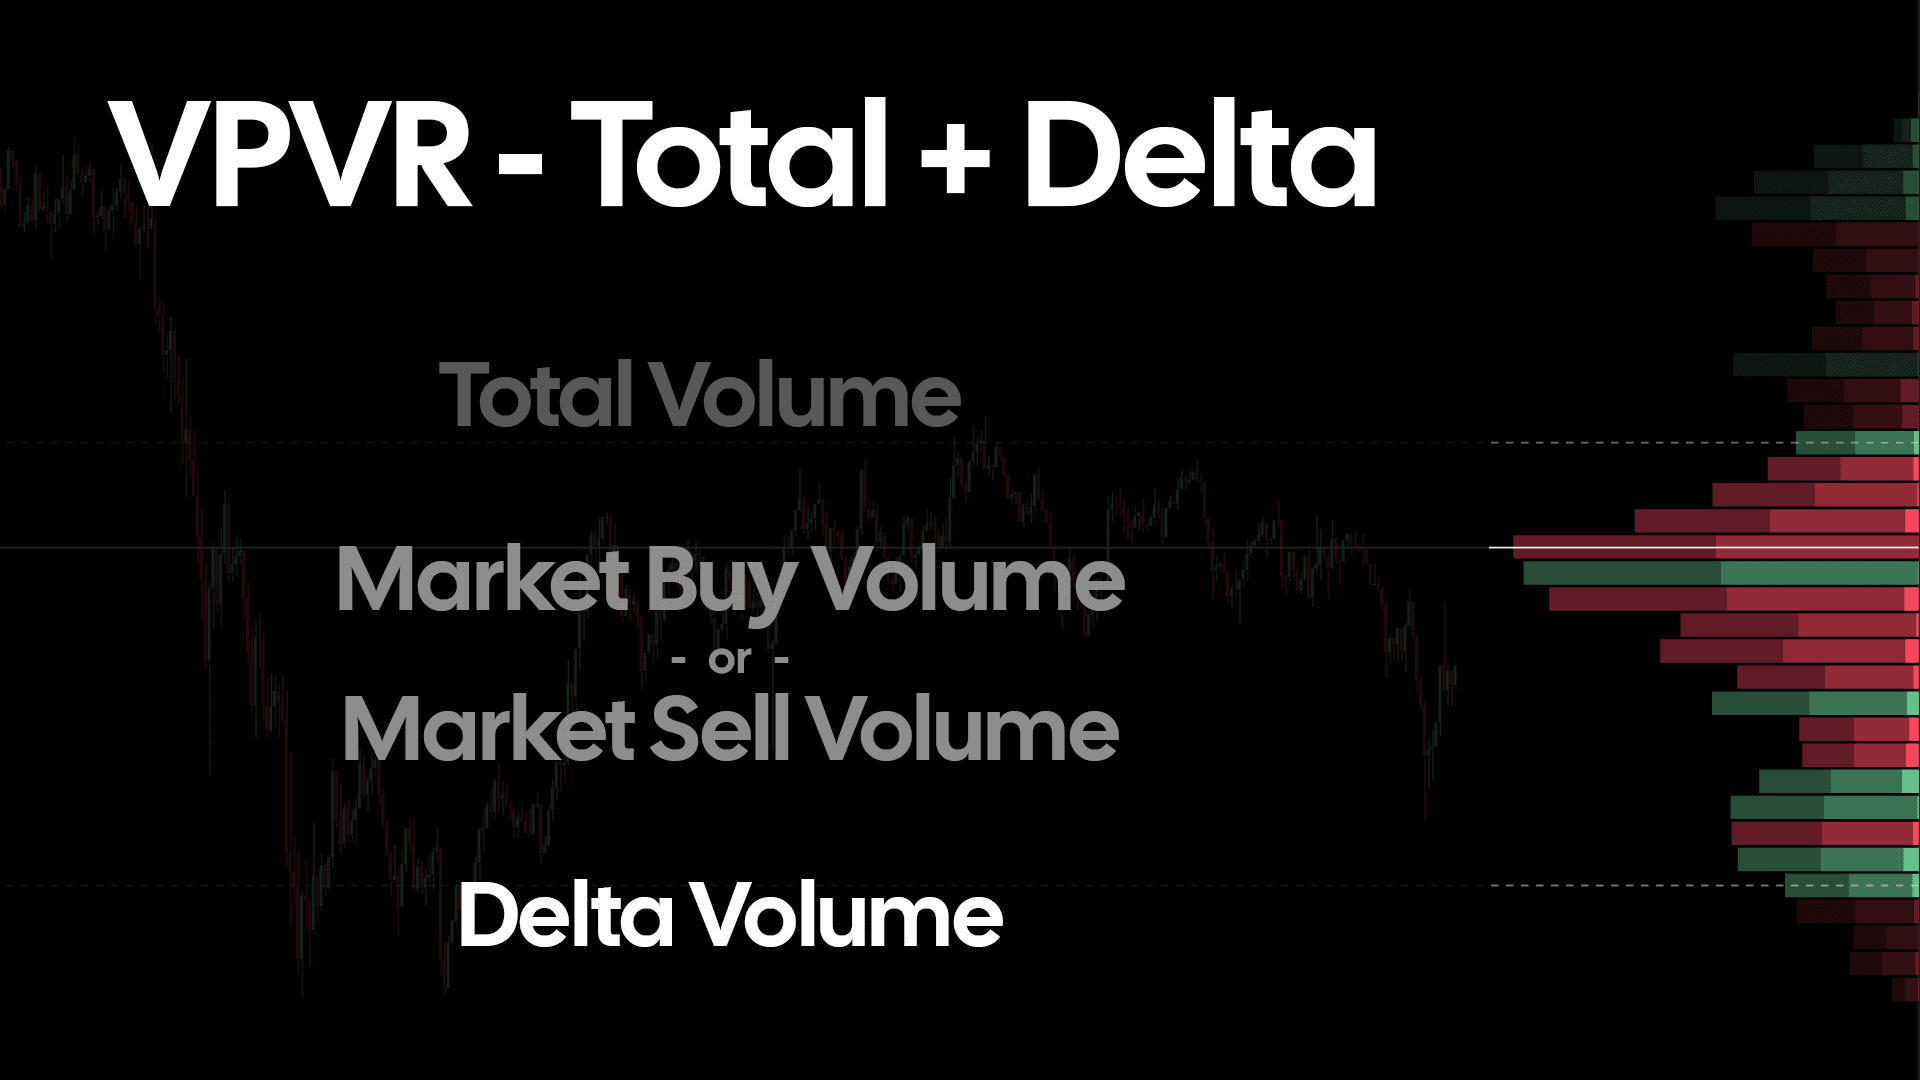
Total + Delta
The 'Total + Delta' option renders 3 distinct layered profiles. Each profile provides an additional data point for that particular price level. As the name suggests, delta plays a key role within this VPVR mode. The first role it plays is the color of each row. Market buy volume and market sell volume is compared to determine which was greater over the price level. If there was greater market buy volume, green is used by default, and vice-vera for market sell volume (red).
Total Volume
The darkest profile, shown in the background of all others, is the Total Volume profile. The width of the row illustrates the total sum of both market buy volume and market sell volume within each price level
Dominant Total Volume
The middle profile that is rendered in front of the total volume, is the dominant market buy or market sell volume. Whichever side possessed the greater volume - the respective side's volume, will be rendered.
Delta Volume
Brightest, at the foreground, is the Delta Volume Profile. This is the net delta of market buy volume and market sell volume recored at each price level. The greater the width, the greater the volume delta recorded within each row.
Activating the VPVR
In order to activate, click on the 'Indicators' indicators tab, and select 'VPVR'.
VPVR Configuration & Settings
There are quite a number configuration options for the Volume Profile Visible Range layer.
Tick Per Row
The Tick per Row input will modify the price grouping used to determine the height of each row within the profile. The larger the value entered, the larger the price grouping and subsequent height of each row within the profile. This setting should be adjusted to suit the timeframe you are examining. To prevent noise, you should scale up the Tick per Row input when analyzing a longer periods of time on your chart.
Origin
Determine which side of the chart you which the VPVR to be rendered. 'Left' or 'Right'. By default this is set to 'Right'.
Width
This input determines the maximum distance the widest row of the profile can span. The higher the value the wider the VPVR profile will be rendered.
Color
By default, market buy volume is designated in green with market sell volume assigned the red. When the 'Total Volume' is enabled, one single color picker is displayed.
Show Values
When enabled, raw values such as market buy volume and market sell volume, total volume, and delta volume are shown depending upon the VPVR mode that is selected.
Show POC
Toggle to highlight as a horizontal line the Point of Control within the Volume Profile. Toggled to 'On' by default, there are additional options including a color picker, in addition to a 'Thickness' input, which will determine the height of the horizontal line that is rendered across the chart.
Value Area %
The input entered will determine the % threshold of the total volume traded over the visible range to be considered as part of the 'Value Area'. By default this is set to 68% which is equal to one standard deviation.